
An in-memory multidimensional database.
Table of contents
1. Overview
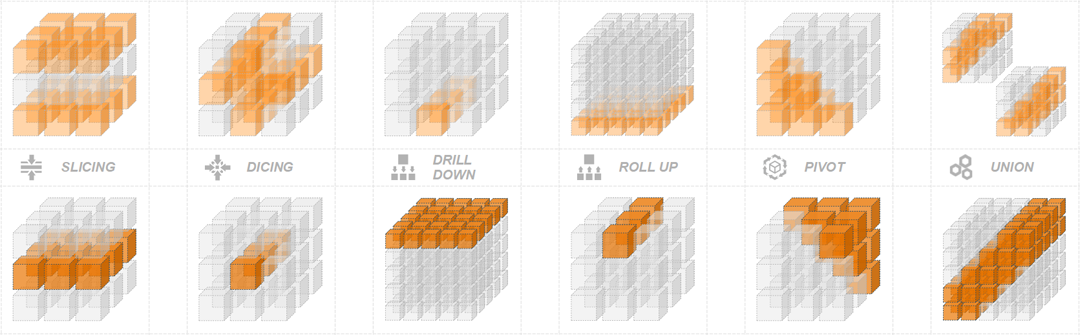
EuclidOLAP organizes data through dimensions and cubes and provides the ability to perform in-depth analysis of data. EuclidOLAP can help you perform faster and more flexible data queries, data analysis, and data mining, whether for detailed or aggregated data, or cross-model correlation data.
2. Features
- Authentic multidimensional data model.
- Provide real-time aggregate computing capabilities for data of any granularity.
- Support for SQL-like language MDX(Multi-Dimensional Expressions).
- An EuclidOLAP service instance can be deployed in as little as one minute.
- Stand-alone mode or distributed architecture.
3. Quick start
Quickly deploy an instance of the EuclidOLAP service, and then perform multidimensional queries based on a demo model.
3.1. Installation
Run an EuclidOLAP service process on Linux by starting a Docker container or directly executing binary.
3.1.1. Docker
Run the following command, quickly launch a Docker container of EuclidOLAP service.
$ docker run -d -p 8760:8760 -p 8761:8761 --name olapd euclidolap/euclidolap:v0.1.5-beta3.1.2. Executing binary
Launch an EuclidOLAP service by executing binary on Linux.
EuclidOLAP currently supports running on Redhat/CentOS and Debian/Ubuntu operating systems.
Execute the following code:
$ wget https://github.com/EuclidOLAP/EuclidOLAP/releases/download/v0.1.5-beta/EuclidOLAP-v0.1.5-beta.tar.gz
$ tar zxf EuclidOLAP-v0.1.5-beta.tar.gz
$ cd EuclidOLAP/bin
$ ./start.sh
3.2. Demo model
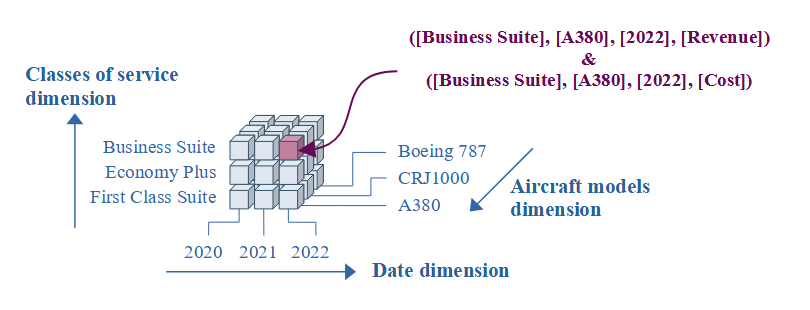
The EuclidOLAP service is preset with a sample data model, which is a cube of airline turnover data that correlates three dimensions: Aircraft Models Dimension, Classes of Service Dimension, and Date Dimension.
3.3. Query examples
You can now execute multidimensional queries based on this sample model.
EuclidOLAP uses MDX(Multi-Dimensional Expressions) as query language, for more details on MDX please refer to MDX Manual.
If you are running the EuclidOLAP service by starting a Docker container, execute the docker exec -it olapd /bin/bash command to enter the Docker container first.
Execute the EuclidOLAP client tool.
$ ./olap-cli3.3.1. Example 1
The following MDX statement will query the revenue for the three years 2020 ~ 2022, run it in the EuclidOLAP client tool, and you will see the results in the table below.
select
  { Date.[2020], Date.[2021], Date.[2022] } on columns,
  { [Measures].Revenue } on rows
from [Airline A];
+---------+--------------+--------------+--------------+
| | 2020 | 2021 | 2022 |
+---------+--------------+--------------+--------------+
| Revenue | 494849380.00 | 590103250.00 | 622211200.00 |
+---------+--------------+--------------+--------------+
3.3.2. Example 2
The following MDX statement will query the revenue corresponding to each service type in 2022.
select
  { [Measures].Revenue } on columns,
  Children([Classes of Service].Root) on rows
from [Airline A]
where (Date.[2022]);
+-----------------------+--------------+
| | Revenue |
+-----------------------+--------------+
| Premium Economy Class | 105711510.00 |
+-----------------------+--------------+
| Basic Economy Class | 167196360.00 |
+-----------------------+--------------+
| Economy Plus | 171715940.00 |
+-----------------------+--------------+
| Business Suite | 85372600.00 |
+-----------------------+--------------+
| Premium Business | 48876700.00 |
+-----------------------+--------------+
| First Class Suite | 25656480.00 |
+-----------------------+--------------+
| Private Jet Charter | 17681610.00 |
+-----------------------+--------------+
3.3.3. Example 3
The following MDX statement queries the annual operating costs for each Boeing aircraft models, with the aircraft models displayed on the row, the years and costs on the column.
select
  Children([Aircraft Models].[Boeing]) on rows,
  CrossJoin(Children(Date.Root), { [Measures].Cost }) on columns
from [Airline A];
+------------+-------------+-------------+-------------+-------------+
| | 2019 | 2020 | 2021 | 2022 |
+------------+-------------+-------------+-------------+-------------+
| | Cost | Cost | Cost | Cost |
+------------+-------------+-------------+-------------+-------------+
| Boeing 737 | 34293040.00 | 29375880.00 | 32928770.00 | 37168600.00 |
+------------+-------------+-------------+-------------+-------------+
| Boeing 747 | 39327910.00 | 27147380.00 | 30939760.00 | 36922360.00 |
+------------+-------------+-------------+-------------+-------------+
| Boeing 757 | 24053550.00 | 19976340.00 | 22849460.00 | 23636330.00 |
+------------+-------------+-------------+-------------+-------------+
| Boeing 767 | 26722080.00 | 20026930.00 | 24037450.00 | 24239440.00 |
+------------+-------------+-------------+-------------+-------------+
| Boeing 777 | 29321340.00 | 22490630.00 | 26517600.00 | 31237380.00 |
+------------+-------------+-------------+-------------+-------------+
| Boeing 787 | 32728610.00 | 21476270.00 | 29365880.00 | 26310350.00 |
+------------+-------------+-------------+-------------+-------------+
3.3.4. Example 4
The following MDX will calculate the revenue percentage for each service class for all Airbus aircraft each year, which will be done using a custom formula that will be defined as a member in the query language.
with
member [Measures].proportion
  as ([Measures].Revenue) / ([Classes of Service].[Root], [Measures].Revenue)
select
  { Date.[2019], Date.[2020], Date.[2021], Date.[2022] } on columns,
  members([Classes of Service]) on rows
from [Airline A]
where ([Measures].proportion, [Aircraft Models].[Airbus]);
+-----------------------+------+------+------+------+
| | 2019 | 2020 | 2021 | 2022 |
+-----------------------+------+------+------+------+
| Root | 1.00 | 1.00 | 1.00 | 1.00 |
+-----------------------+------+------+------+------+
| Premium Economy Class | 0.18 | 0.19 | 0.17 | 0.16 |
+-----------------------+------+------+------+------+
| Basic Economy Class | 0.27 | 0.27 | 0.26 | 0.27 |
+-----------------------+------+------+------+------+
| Economy Plus | 0.28 | 0.26 | 0.28 | 0.27 |
+-----------------------+------+------+------+------+
| Business Suite | 0.13 | 0.14 | 0.14 | 0.14 |
+-----------------------+------+------+------+------+
| Premium Business | 0.08 | 0.08 | 0.07 | 0.09 |
+-----------------------+------+------+------+------+
| First Class Suite | 0.04 | 0.04 | 0.04 | 0.04 |
+-----------------------+------+------+------+------+
| Private Jet Charter | 0.03 | 0.03 | 0.03 | 0.03 |
+-----------------------+------+------+------+------+
4. Why use EuclidOLAP?
Deploying the EuclidOLAP service is very simple, there is no need to rely on a running environment other than the Linux operating system, by starting a Docker container you can immediately run an EuclidOLAP stand-alone service, and it only takes a few minutes to build an EuclidOLAP distributed cluster service.
When you use EuclidOLAP for data analysis, you only need to care about the semantic layer close to the real business model, and do not need to care about problems such as data aggregation, sparse dimension and dense dimension that are not directly related to the business, so EuclidOLAP's Ad-Hoc query capability is very powerful, which can better support you to conduct exploratory and random data analysis behavior.
EuclidOLAP also extends the multidimensional data model, for example, adding the concept of dimensional role, which means that a cube can be associated with the same dimension multiple times, and each association indicates that this dimension represents a different role, which can better support certain data analysis scenarios, for example, statistical analysis of international trade ocean transport ship logistics data, which contains the ship's departure date and port call date.
5. Future planning
- Use GPU to improve the operation efficiency of real-time aggregate computing.
- Support real-time aggregation calculation and pre-aggregation calculation two modes.
- Use cloud-native elastic computing capabilities to achieve rapid real-time analysis of ultra-large-scale datasets (greater than 1,000 billion detailed data).
- Human-machine dialogue and machine assistant data analysis mode based on AI.
6. License
EuclidOLAP under the Apache License, Version 2.0.
