This is a python port of the R stargazer package that can be found on CRAN. I was disappointed that there wasn't equivalent functionality in any python packages I was aware of so I'm re-implementing it here.
There is an experimental function in the statsmodels.regression.linear_model.OLSResults.summary2 that can report single regression model results in HTML/CSV/LaTeX/etc, but it still didn't quite fulfill what I was looking for.
The python package is object oriented now with chained commands to make changes to the rendering parameters, which is hopefully more pythonic and the user doesn't have to put a bunch of arguments in a single function.
You can install this package through PyPi with pip install stargazer or just clone the repo and take the stargazer.py file since it's the only one in the package.
It depends on statsmodels, which in turn depends on several other libraries like pandas, numpy, etc
This library implements many of the customization features found in the original package. Examples of most can be found in the examples jupyter notebook and a full list of the methods/features is here below:
-
title: custom title -
show_header: display or hide model header data -
show_model_numbers: display or hide model numbers -
custom_columns: custom model names and model groupings -
significance_levels: change statistical significance thresholds -
significant_digits: change number of significant digits -
show_confidence_intervals: display confidence intervals instead of variance -
dependent_variable_name: rename dependent variable -
rename_covariates: rename covariates -
covariate_order: reorder covariates -
reset_covariate_order: reset covariate order to original ordering -
show_degrees_of_freedom: display or hide degrees of freedom -
custom_note_label: label notes section at bottom of table -
add_custom_notes: add custom notes to section at bottom of the table -
add_line: add a custom line to the table -
append_notes: display or hide statistical significance thresholds
These features are agnostic of the rendering type and will be applied whether the user outputs in HTML, LaTeX, etc
Here is an examples of how to quickly get started with the library. More examples can be found in the examples.ipynb file in the github repo. The examples all use the scikit-learn diabetes dataset, but it is not a dependency for the package.
import pandas as pd
from sklearn import datasets
import statsmodels.api as sm
from stargazer.stargazer import Stargazer

diabetes = datasets.load_diabetes()
df = pd.DataFrame(diabetes.data)
df.columns = ['Age', 'Sex', 'BMI', 'ABP', 'S1', 'S2', 'S3', 'S4', 'S5', 'S6']
df['target'] = diabetes.target

est = sm.OLS(endog=df['target'], exog=sm.add_constant(df[df.columns[0:4]])).fit()
est2 = sm.OLS(endog=df['target'], exog=sm.add_constant(df[df.columns[0:6]])).fit()

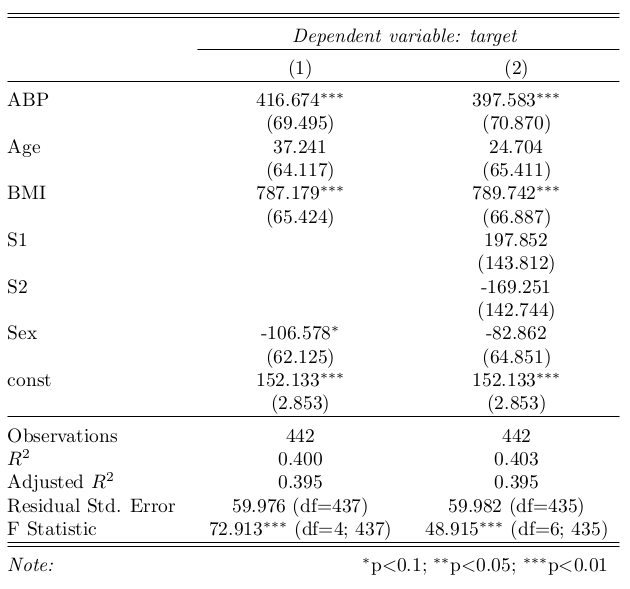
stargazer = Stargazer([est, est2])stargazer.render_html()| Dependent variable: target | ||
| (1) | (2) | |
| ABP | 416.674*** | 397.583*** |
| (69.495) | (70.870) | |
| Age | 37.241 | 24.704 |
| (64.117) | (65.411) | |
| BMI | 787.179*** | 789.742*** |
| (65.424) | (66.887) | |
| S1 | 197.852 | |
| (143.812) | ||
| S2 | -169.251 | |
| (142.744) | ||
| Sex | -106.578* | -82.862 |
| (62.125) | (64.851) | |
| const | 152.133*** | 152.133*** |
| (2.853) | (2.853) | |
| Observations | 442 | 442 |
| R2 | 0.400 | 0.403 |
| Adjusted R2 | 0.395 | 0.395 |
| Residual Std. Error | 59.976 (df=437) | 59.982 (df=435) |
| F Statistic | 72.913*** (df=4; 437) | 48.915*** (df=6; 435) |
| Note: | *p<0.1; **p<0.05; ***p<0.01 | |
stargazer.render_latex()