TermChart
Draw ascii line charts in terminal.
Install
pip3 install termchartUsage
Create a Python file :
import termchart
graph = termchart.Graph([1,2,3,2,5,1,-1,-5,-3])
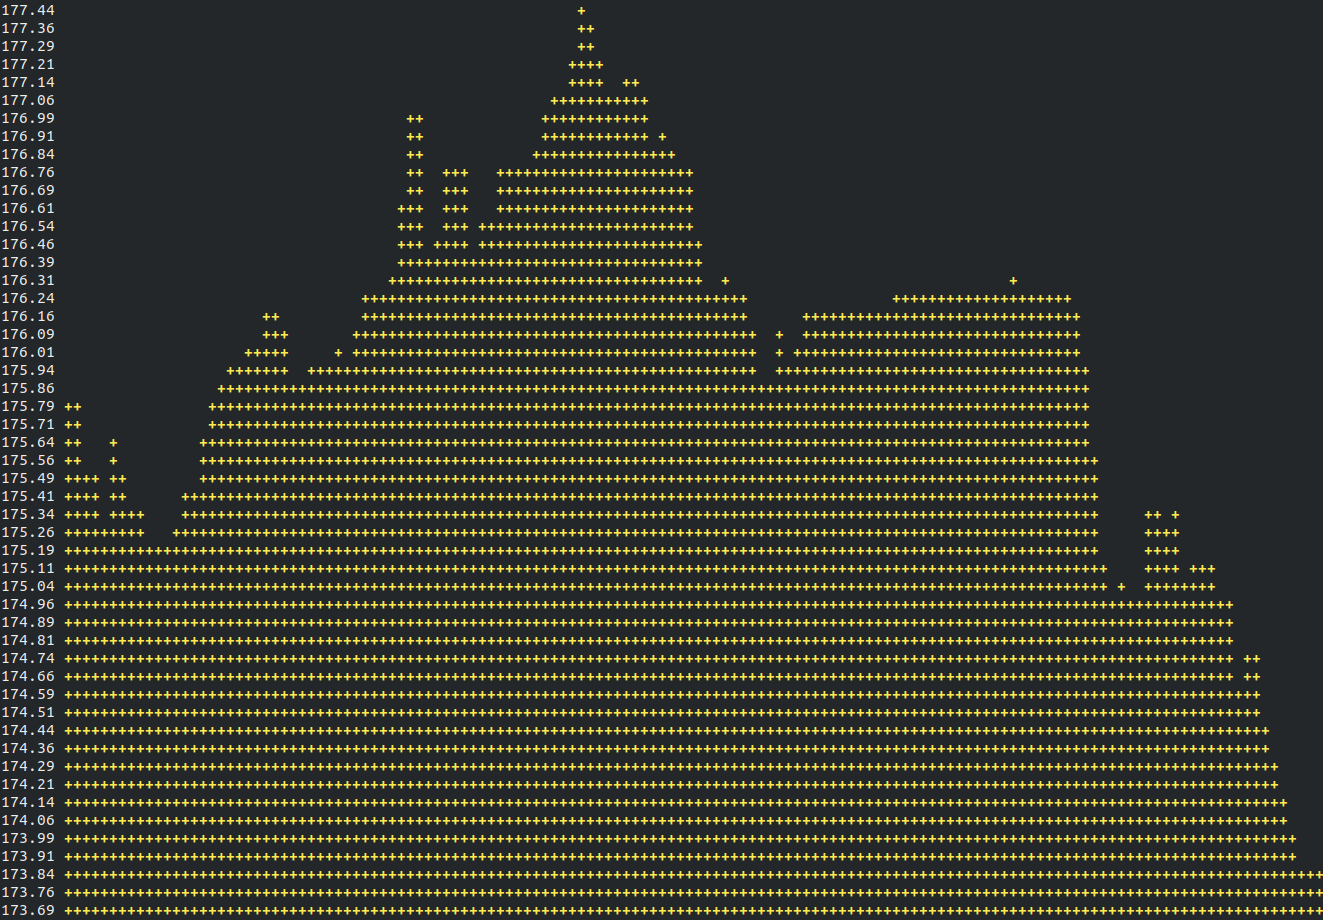
graph.draw()You can change the plot (default is +):
graph.setDot('|')Change the width and height (default cols is 160x50)
graph.setCols(200)
graph.setRows(40)
Add values whenever you need it with addData(<Float>). Here is a full example for a live graph with random values :
import termchart
import time
import os
from random import randint

graph = termchart.Graph([])
while True:
    rand = randint(0, 9)
    graph.addData(rand)
    graph.draw()
    time.sleep(1)
    os.system('cls' if os.name == 'nt' else 'clear')