TREECUT: Dynamic tree cut algorithm


| Author | Haibao Tang (tanghaibao) |
| Jingping Li (Jingping) | |
| tanghaibao@gmail.com | |
| License | BSD |
Description
Hierarchical clustering is an important tool in mining useful relationships among multivariate biological data. However, there is no obvious way to define a set of useful, non-overlapping groups from the identified hierarchy. Most efforts have focused on different cut-off values, evaluate the relative strengths of intra- versus inter- group variances and then heuristically determine a "good" cutoff. This study introduces a more dynamic approach that extracts clades that are significantly enriched or different from other clades. Incorporating phylogenetic information removes the false positives observed in a conventional analysis thus improves the prediction of trait association.
The algorithm takes two inputs, a tree model and some mapping of values for all the terminal branches. Briefly, the algorithm performs independent statistical tests on all the internal branches, and calculates the P-values for each node. At exploratory stage, the statistical tests are: 1) for quantitative values, test the difference of two groups separated by each node (student's t-test); 2) for categorical values, test the association of a particular category for the descendants of each internal node (Fisher's exact test).
The candidate nodes are determined using the following rule: the P-value for the candidate node v has to be the smallest among all root-to-leaf paths that pass v. In other words, the group rooted at node v should contain the largest level of association, thus avoiding redundant clades.
Server version
A server version of TREECUT software can be found here: http://chibba.agtec.uga.edu/duplication/cut/
Installation
pip install scipy ete2Usage
Take a look at examples in the data/ folder: treefile and
listfile.
The treefile should be a
Newick-formatted file
(typically from the output of a phylogenetic reconstruction software,
e.g. phylip or
MEGA).
The listfile should contain the quantitative value for each taxon
(separated by comma). Make sure that the taxon names match between
treefile and listfile:
# continuous example
IS13,57.2
IS35,66.13
If the data type is discrete, separate the classes by semicolon. For example:
# discrete example
AT1G02150,GO:0009507;GO:0005488
AT1G02160,GO:0005575;GO:0003674;GO:0008150
Note that # represents a comment line and will be ignored.
To run the software:
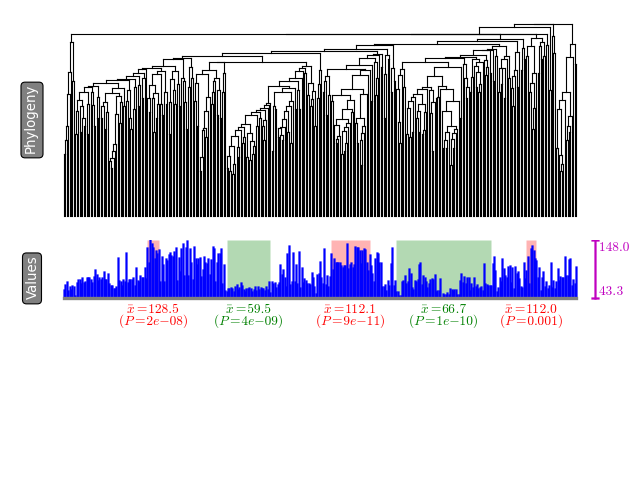
python treecut.py data/tree.nwk data/continuous.csv tree.pdfA summary of extracted modules will be written to stdout. Each row
will contain a subclade that show either significantly high phenotypic
value or low phenotypic value. Further a visualization is available as
tree.pdf (supported image formats include svg, png, pdf, jpg,
etc.). The modules are highlighted in green (low-value modules) and red
(high-value modules) colors.
Cookbook
There are several immediate applications of TREECUT. Below just show case two examples, but there are more.
Extract taxonomic groups with high/low phenotype values
See an example in the data/ folder. This is the flowering time data
for sorghum diversity panel. flowering.nwk is a phylogenetic tree for
the sorghum accessions used in the study. flowering.assoc has the
mapping to the accession to the trait values (in this case the number of
days until flowering). To run:
python treecut.py data/flowering.nwk data/flowering.assocIf you stead want to treat the flowering data as discrete values, say
"high" versus low. You can add a --discrete option:
python treecut.py data/flowering.nwk data/flowering_discrete.assoc --discrete flowering_discrete.pngThe significant different clades (like extreme trait values) will be written to the screen.
Extract co-expressed genes with functional enrichment
In this example, I used Eisen's CLUSTER software
(here)
to process a series of arabidopsis microarray series
AtGenExpress.
After the CLUSTER is run. I found two files - microarray.cdt and
microarray.gtr. The .gtr file contains a hierarchical tree
structure, but I need to convert it to .nwk format in order for
treecut.py to process.
Take a look at microarray.assoc, this contains the mapping from
arabidopsis genes to the GO terms, which are based on the information
downloaded at Gene Ontology
website.
Note that a gene can have multiple GO terms associated with it. Here is
the script that I used to create the microarray.assoc:
python scripts/parse_tair_go.pyOnce everything is set, just run treecut.py as usual (make sure to
turn on the --discrete option):
python scripts/eisen_to_newick.py data/microarray.gtr data/microarray.cdt data/microarray.nwk
python treecut.py data/microarray.nwk data/microarray.assoc --discrete
The clades that are significantly enriched in certain GO terms will be written to the screen.
Reference
Tang et al. TREECUT: algorithm for extracting significant modules from hierarchical clustering
