MVP 


A Memory-efficient, Visualization-enhanced, and Parallel-accelerated Tool for Genome-Wide Association Study
![]()
#-----------------------rMVP v1.0.0 is coming, and better again!------------------------#
Repos:
Github: https://github.com/xiaolei-lab/rMVP
Gitee(quick access in China): https://gitee.com/xiaolei-lab/rMVP
Authors:
Design and Maintenance: Lilin Yin#, Haohao Zhang#, Shuhong Zhao, Xinyun Li, and Xiaolei Liu.
Contributors: Zhenshuang Tang, Jingya Xu, Dong Yin, Zhiwu Zhang, Xiaohui Yuan, Mengjin Zhu
Citation: Yin L, Zhang H, Tang Z, Xu J, Yin D, Zhang Z, Yuan X, Zhu M, Zhao S, Li X. rMVP: A Memory-efficient, Visualization-enhanced, and Parallel-accelerated tool for Genome-Wide Association Study, Genomics, Proteomics & Bioinformatics , 2021, 19 (4), 619-628, doi: 10.1016/j.gpb.2020.10.007.
Questions, suggestions, and bug reports are welcome and appreciated: xiaoleiliu@mail.hzau.edu.cn
🧰 Relevant software tools for genetic analyses and genomic breeding
| 📫 HIBLUP: Versatile and easy-to-use GS toolbox. | 🍀 SIMER: data simulation for life science and breeding. |
| 🚴♂️ KAML: Advanced GS method for complex traits. | 🏔️ IAnimal: an omics knowledgebase for animals. |
| 🏊 hibayes: A Bayesian-based GWAS and GS tool. | 📊 CMplot: A drawing tool for genetic analyses. |
Contents
Installation
WE STRONGLY RECOMMEND TO INSTALL MVP ON Microsoft R Open(https://mran.microsoft.com/download/) (deprecated)
- The stable version:
install.packages("rMVP")- The latest version:
devtools::install_github("xiaolei-lab/rMVP")After installed successfully, MVP can be loaded by typing
library(rMVP)Typing ?MVP could get the details of all parameters.
For more help on Windows installation, see the wiki page (Chinese)
Data Preparation
Phenotype
back to top
We suggest to provide the phenotype file, users needn't to manually pre-treat the order of phenotype and genotype individuals, MVP could automatically adjust the order of genotype file to be consistent with phenotype file.
| Taxa | trait1 | trait2 | trait3 |
|---|---|---|---|
| 33-16 | 101.5 | 0.25 | 0 |
| 38-11 | 102.7 | 0.23 | 1 |
| 4226 | 101.2 | -0.17 | 1 |
| 4722 | 105.5 | NA | 0 |
| A188 | 108.1 | 0.57 | 1 |
| A214N | 95.13 | 0.87 | 0 |
| A239 | 100.2 | -0.16 | 1 |
PLINK binary
back to top
If you have genotype data in PLINK Binary format (details see http://zzz.bwh.harvard.edu/plink/data.shtml#bed):
fileBed, name of genotype data in PLINK Binary format
fileKin, TRUE or FALSE, if TRUE, kinship matrix represents relationship among individuals will be calculated
filePC, TRUE or FALSE, if TRUE, principal component analysis will be performed
out, prefix of output file
priority, "speed" or "memory", the "speed" mode is faster but uses more memory while "memory" is slower but uses less memory
maxLine, number, if priority = "memory", it is the number of markers read into memory
# Full-featured function (Recommended)
MVP.Data(fileBed="plink",
         filePhe=NULL,
         fileKin=FALSE,
         filePC=FALSE,
         #priority="speed",
         #maxLine=10000,
         out="mvp.plink"
         )

# Only convert genotypes
MVP.Data.Bfile2MVP(bfile="plink", out='mvp', maxLine=1e4, priority='speed') # the genotype data should be fully imputed before using this function
VCF
back to top
If you have genotype data in VCF format:
fileVCF, name of genotype data in VCF format
filePhe, name of phenotype data
sep.phe, separator of phenotype file
fileKin, TRUE or FALSE, if TRUE, kinship matrix represents relationship among individuals will be calculated
filePC, TRUE or FALSE, if TRUE, principal component analysis will be performed
out, the prefix of output file
##fileformat=VCFv4.2
##fileDate=20171105
##source=PLINKv1.90
##contig=<ID=1,length=2>
##INFO=<ID=PR,Number=0,Type=Flag,Description="Provisional reference allele, may not be based on real reference genome">
##FORMAT=<ID=GT,Number=1,Type=String,Description="Genotype">
#CHROM	POS	ID	REF	ALT	QUAL	FILTER	INFO	FORMAT	-9_CZTB0004	-9_CZTB0006	-9_CZTB0008	-9_CZTB0010	-9_CZTB0011	-9_CZTB0012
1	1	10000235	A	C	.	.	PR	GT	0/1	0/0	0/0	0/0	0/0	0/1
1	1	10000345	A	G	.	.	PR	GT	0/0	0/0	0/0	0/0	1/1	1/1
1	1	10004575	G	.	.	.	PR	GT	0/0	0/0	0/0	0/0	0/0	0/0
1	1	10006974	C	T	.	.	PR	GT	0/0	0/0	0/1	1/1	0/1	1/1
1	1	10006986	A	G	.	.	PR	GT	0/0	0/0	0/1	./.	1/1	1/1
# Full-featured function (Recommended)
MVP.Data(fileVCF="myVCF.vcf",
         #filePhe="Phenotype.txt",
         fileKin=FALSE,
         filePC=FALSE,
         out="mvp.vcf"
         )

# Only convert genotypes
MVP.Data.VCF2MVP("myVCF.vcf", out='mvp') # the genotype data should be fully imputed before using this function
Hapmap
back to top
If you have genotype data in Hapmap format:
fileHMP, a string or a string vector, e.g. fileHMP = "hapmap.txt" or fileHMP = c("chr1.hmp.txt", "chr2.hmp.txt", "chr3.hmp.txt")
filePhe, name of phenotype file
sep.phe, separator of phenotype file
fileKin, TRUE or FALSE, if TRUE, kinship matrix represents relationship among individuals will be calculated
filePC, TRUE or FALSE, if TRUE, principal component analysis will be performed
out, the prefix of output file
priority, "speed" or "memory", the 'speed' mode is faster but uses more memory while 'memory' is slower but uses less memory
maxLine, number, if priority = "memory", it is the number of markers read into memory
hapmap.txt
| rs# | alleles | chrom | pos | strand | assembly# | center | protLSID | assayLSID | panelLSID | QCcode | 33-16 | 38-11 | 4226 | 4722 | A188 | ... | A239 |
|---|---|---|---|---|---|---|---|---|---|---|---|---|---|---|---|---|---|
| rs3683945 | G/A | 1 | 3197400 | + | NA | NA | NA | NA | NA | NA | AG | AG | GG | AG | GG | ... | AA |
| rs3707673 | A/G | 1 | 3407393 | + | NA | NA | NA | NA | NA | NA | GA | GA | AA | GA | AA | ... | GG |
| rs6269442 | G/A | 1 | 3492195 | + | NA | NA | NA | NA | NA | NA | AG | GG | GG | AG | GG | ... | AA |
| rs6336442 | G/A | 1 | 3580634 | + | NA | NA | NA | NA | NA | NA | AG | AG | GG | AG | GG | ... | AA |
| rs13475699 | G | 1 | 3860406 | + | NA | NA | NA | NA | NA | NA | GG | GG | GG | GG | GG | ... | GG |
# Full-featured function (Recommended)
MVP.Data(fileHMP="hapmap.txt",
         filePhe="Phenotype.txt",
         sep.hmp="\t",
         sep.phe="\t",
         SNP.effect="Add",
         fileKin=FALSE,
         filePC=FALSE,
         #priority="memory",
         #maxLine=10000,
         out="mvp.hmp"
         )

# Only convert genotypes
MVP.Data.Hapmap2MVP("hapmap.txt", out='mvp') # the genotype data should be fully imputed before using this function
Numeric
back to top
If you have genotype data in Numeric (m * n, m rows and n columns, m is the number of SNPs, n is the number of individuals) format:
fileNum, name of genotype data in Numeric format
filePhe, name of phenotype file
fileMap, name of map file, a header should be added, e.g. SNP Chr Pos
sep.num, separator of Numeric file
sep.phe, separator of phenotype file
type.geno, the type of data in Numeric file, "char", "integer", or "double"
fileKin, TRUE or FALSE, if TRUE, kinship matrix represents relationship among individuals will be calculated
filePC, TRUE or FALSE, if TRUE, principal component analysis will be performed
out, the prefix of output file
priority, "speed" or "memory", the "speed" mode is faster but uses more memory while "memory" is slower but uses less memory
maxLine, number, if priority = "memory", it is the number of markers read into memory
auto_transpose, bool, if auto_transpose = TRUE, it is automatically transposed to ensure that the number of rows (markers) is greater than the number of columns (individuals).
Numeric.txt |
Map.txt |
|||||||||||||||||||||||||||||||||||||||||||||||||||||
|
|
# Full-featured function (Recommended)
MVP.Data(fileNum="Numeric.txt",
         filePhe="Phenotype.txt",
         fileMap="Map.txt",
         sep.num="\t",
         sep.map="\t",
         sep.phe="\t",
         fileKin=FALSE,
         filePC=FALSE,
         #priority="memory",
         #maxLine=10000,
         out="mvp.num"
         )

# Only convert genotypes
MVP.Data.Numeric2MVP("Numeric.txt", out='mvp', maxLine=1e4, priority='speed', auto_transpose=T) # the genotype data should be fully imputed before using this function
Kinship
back to top
If you have Kinship matrix data that represents the relationship among individuals
fileKin, name of Kinship matrix data, the dimension is n * n (n is sample size), no taxa names included
sep.kin, separator of Kinship file
mvp.kin.txt
| 0.3032 | -0.0193 | 0.0094 | 0.0024 | 0.0381 | ... | -0.0072 |
| -0.0193 | 0.274 | -0.0243 | 0.0032 | -0.0081 | ... | 0.0056 |
| 0.0094 | -0.0243 | 0.3207 | -0.0071 | -0.0045 | ... | -0.0407 |
| 0.0024 | 0.0032 | -0.0071 | 0.321 | -0.008 | ... | -0.0093 |
| 0.0381 | -0.0081 | -0.0045 | -0.008 | 0.3498 | ... | -0.0238 |
| ... | ... | ... | ... | ... | ... | ... |
| -0.0072 | 0.0056 | -0.0407 | -0.0093 | -0.0238 | ... | 0.3436 |
# read from file
MVP.Data.Kin("mvp.kin.txt", out="mvp", maxLine=1e4, priority='memory', sep='\t')

# calculate from mvp_geno_file
MVP.Data.Kin(TRUE, mvp_prefix='mvp', out='mvp')
Principal Components
back to top
If you have Principal Components data
filePC, name of Principal Components matrix data, the dimension is n * nPC (n is sample size, nPC is number of first columns of PCs), no taxa names and header row included
sep.pc, separator of Principal Components file
mvp.pc.txt
| 0.010175524 | -0.037989071 | 0.009588312 |
| -0.009138673 | -0.036763080 | -0.006396714 |
| -0.004723734 | -0.047837625 | 0.021687731 |
| 0.012887843 | -0.048418352 | 0.054298850 |
| 0.003871951 | -0.038070387 | 0.008020508 |
| -0.079505846 | 0.005818163 | -0.206364549 |
# read from file
MVP.Data.PC("mvp.pc.txt", out='mvp', sep='\t')

# calculate from mvp_geno_file
MVP.Data.PC(TRUE, mvp_prefix='mvp', perc=1, pcs.keep=5)
Data Input
Basic
back to top
At least you should prepare three datasets: genotype, phenotype, and map
genotype, genotype data generated by 'MVP.Data' function
phenotype, phenotype data, the first column is taxa name and second column is phenotype value
map, SNP map information, the first column is SNP name, the second column is Chromosome ID, the third column is phsical position
genotype <- attach.big.matrix("mvp.geno.desc")
phenotype <- read.table("mvp.phe",head=TRUE)
map <- read.table("mvp.geno.map" , head = TRUE)
Advanced
back to top
You can give MVP the prepared Kinship matrix and Covariates data generated by 'MVP.Data' function
Kinship, Kinship matrix, the dimension of Kinship matrix is n * n (n is sample size), no taxa names included
Covariates, Covariates matrix, the dimension of Covariates matrix is n * nCV (n is sample size, nCV is number of covariates, no taxa names and header row included
NOTE: If pcs have been added in covariate files, PLEASE DO NOT assign value to nPC.GLM, nPC.MLM, nPC.FarmCPU.
```r
Kinship <- attach.big.matrix("mvp.kin.desc")
Covariates_PC <- bigmemory::as.matrix(attach.big.matrix("mvp.pc.desc"))
If you have additional fixed effects (breed, sex) or covariates (weight), please use it as following:
Covariates <- model.matrix(~as.factor(breed)+as.factor(sex)+as.numeric(weight), data=yourdata)

# if you are supposed to take PC to covariate
Covariates <- cbind(Covariates, Covariates_PC)
NOTE: rMVP has no function of adjusting the order of individuals in covariates. PLEASE make sure the order of individuals in covariates file must be consistent with the output phenotype file of 'MVP.Data'.
If you have prepared Kinship matrix and Covariates data generated by other software packages, see Kinship and Principal Components
Start GWAS
Three models are included in MVP package: General Linear Model (GLM), Mixed Linear Model (MLM), and FarmCPU.
phe, phenotype data
geno, genotype data
map, map data
K, Kinship matrix
CV.GLM, Covariates added in GLM
CV.MLM, Covariates added in MLM
CV.FarmCPU, Covariates added in FarmCPU
If you don't want to add PCs as covariates, please comment out the parameters instead of setting the nPC to 0
please attention that if nPC.GLM > 0, no PCs should be added in CV.GLM
nPC.GLM, number of first columns of Principal Components added in GLM
please attention that if nPC.MLM > 0, no PCs should be added in CV.MLM
nPC.MLM, number of first columns of Principal Components added in MLM
please attention that if nPC.FarmCPU > 0, no PCs should be added in CV.FarmCPU
nPC.FarmCPU, number of first columns of Principal Components added in FarmCPU
priority, "speed" or "memory" when calculating the genomic relationship matrix
ncpus, number of CPUs used for parallel computation, If not set, all CPUs will be used by default
vc.method, methods of variance components analysis, three methods are avaiblable, "BRENT", "EMMA", and "HE"
maxLoop, a parameter for FarmCPU only, the maximum iterations allowed in FarmCPU
method.bin, a parameter for FarmCPU only, two options are available: 'static' or 'FaST-LMM'
permutation.threshold, if TRUE, a threshold of permutation will be used in manhattan plot. The phenotypes are permuted to break the relationship with the genotypes. The experiment is replicated for a number of times. A vector of minimum p value of all experiments is recorded and the 95% quantile value of this vector is recommended to be used as significant threshold
permutation.rep, number of permutation replicates, only used when permutation.threshold is TRUE
threshold, 0.05/marker size, a cutoff line on manhattan plot
method, models for association tests, three models are available in MVP, "GLM", "MLM", and "FarmCPU", one or two or three models can be selected for association tests
file.output, a Boolean value or a string vector. If TRUE, output all types of files. If FALSE, no files are output. For string vectors, the available values are c("pmap", "pmap.signal", "plot", "log"). Among them, pmap represents all SNP P-Val files, pmap.signal represents significant SNP files, Plot represents visualization results, and log represents log files.
imMVP <- MVP(
    phe=phenotype,
    geno=genotype,
    map=map,
    #K=Kinship,
    #CV.GLM=Covariates,  ##if you have additional covariates, please keep there open.
    #CV.MLM=Covariates,
    #CV.FarmCPU=Covariates,
    nPC.GLM=5,   ##if you have added PCs into covariates, please keep there closed.
    nPC.MLM=3,  ##if you don't want to add PCs as covariates, please comment out the parameters instead of setting the nPC to 0.
    nPC.FarmCPU=3,
    priority="speed",   ##for Kinship construction
    #ncpus=10,
    vc.method="BRENT",  ##only works for MLM
    maxLoop=10,
    method.bin="static",   ## "FaST-LMM", "static" (#only works for FarmCPU)
    #permutation.threshold=TRUE,
    #permutation.rep=100,
    threshold=0.05,
    method=c("GLM", "MLM", "FarmCPU"),
    file.output=c("pmap", "pmap.signal", "plot", "log")
)
If you have more than one phenotype
for(i in 2:ncol(phenotype)){
  imMVP <- MVP(
    phe=phenotype[, c(1, i)],
    geno=genotype,
    map=map,
    #K=Kinship,
    #CV.GLM=Covariates,
    #CV.MLM=Covariates,
    #CV.FarmCPU=Covariates,
    nPC.GLM=5,
    nPC.MLM=3,
    nPC.FarmCPU=3,
    priority="speed",
    #ncpus=10,
    vc.method="BRENT",
    maxLoop=10,
    method.bin="static",
    #permutation.threshold=TRUE,
    #permutation.rep=100,
    threshold=0.05,
    method=c("GLM", "MLM", "FarmCPU"),
    file.output=c("pmap", "pmap.signal", "plot", "log")
  )
  gc()
}
Output
back to top
MVP automatically outputs high-quality figures, three types of figure formats are available (".jpg",".pdf",".tiff", default is ".jpg"). Users could also adjust the output figure using about 50 parameters in MVP.Report().
MVP.Report() not only accept the final return of MVP(), but also accepts results from third-party software packages, such as PLINK, GEMMA, GAPIT, TASSEL, and FarmCPU. The result from third-party software packages should at least contain four columns, which are marker name, chromosome, physical position, and P-value of a trait, results of more than one trait could be sequentially appended column by column. Typing ?MVP.Report() to see details of all parameters and typing data(pig60K) or data(cattle50K) to load demo datasets. Type ?MVP.Repory to see parameter details.
> data(pig60K)   #GWAS result of MLM
> data(cattle50K)   #SNP effects calculated from rrblup

> head(pig60K)

          SNP Chromosome Position    trait1     trait2     trait3
1 ALGA0000009          1    52297 0.7738187 0.51194318 0.51194318
2 ALGA0000014          1    79763 0.7738187 0.51194318 0.51194318
3 ALGA0000021          1   209568 0.7583016 0.98405289 0.98405289
4 ALGA0000022          1   292758 0.7200305 0.48887140 0.48887140
5 ALGA0000046          1   747831 0.9736840 0.22096836 0.22096836
6 ALGA0000047          1   761957 0.9174565 0.05753712 0.05753712

> head(cattle50K)

   SNP chr    pos Somatic cell score  Milk yield Fat percentage
1 SNP1   1  59082        0.000244361 0.000484255    0.001379210
2 SNP2   1 118164        0.000532272 0.000039800    0.000598951
3 SNP3   1 177246        0.001633058 0.000311645    0.000279427
4 SNP4   1 236328        0.001412865 0.000909370    0.001040161
5 SNP5   1 295410        0.000090700 0.002202973    0.000351394
6 SNP6   1 354493        0.000110681 0.000342628    0.000105792
In the demo datasets, the first three columns are marker name, chromosome, and physical position, respectively, the rest columns are the P-value or effect of multiple traits. Number of traits is theoretically unlimited.
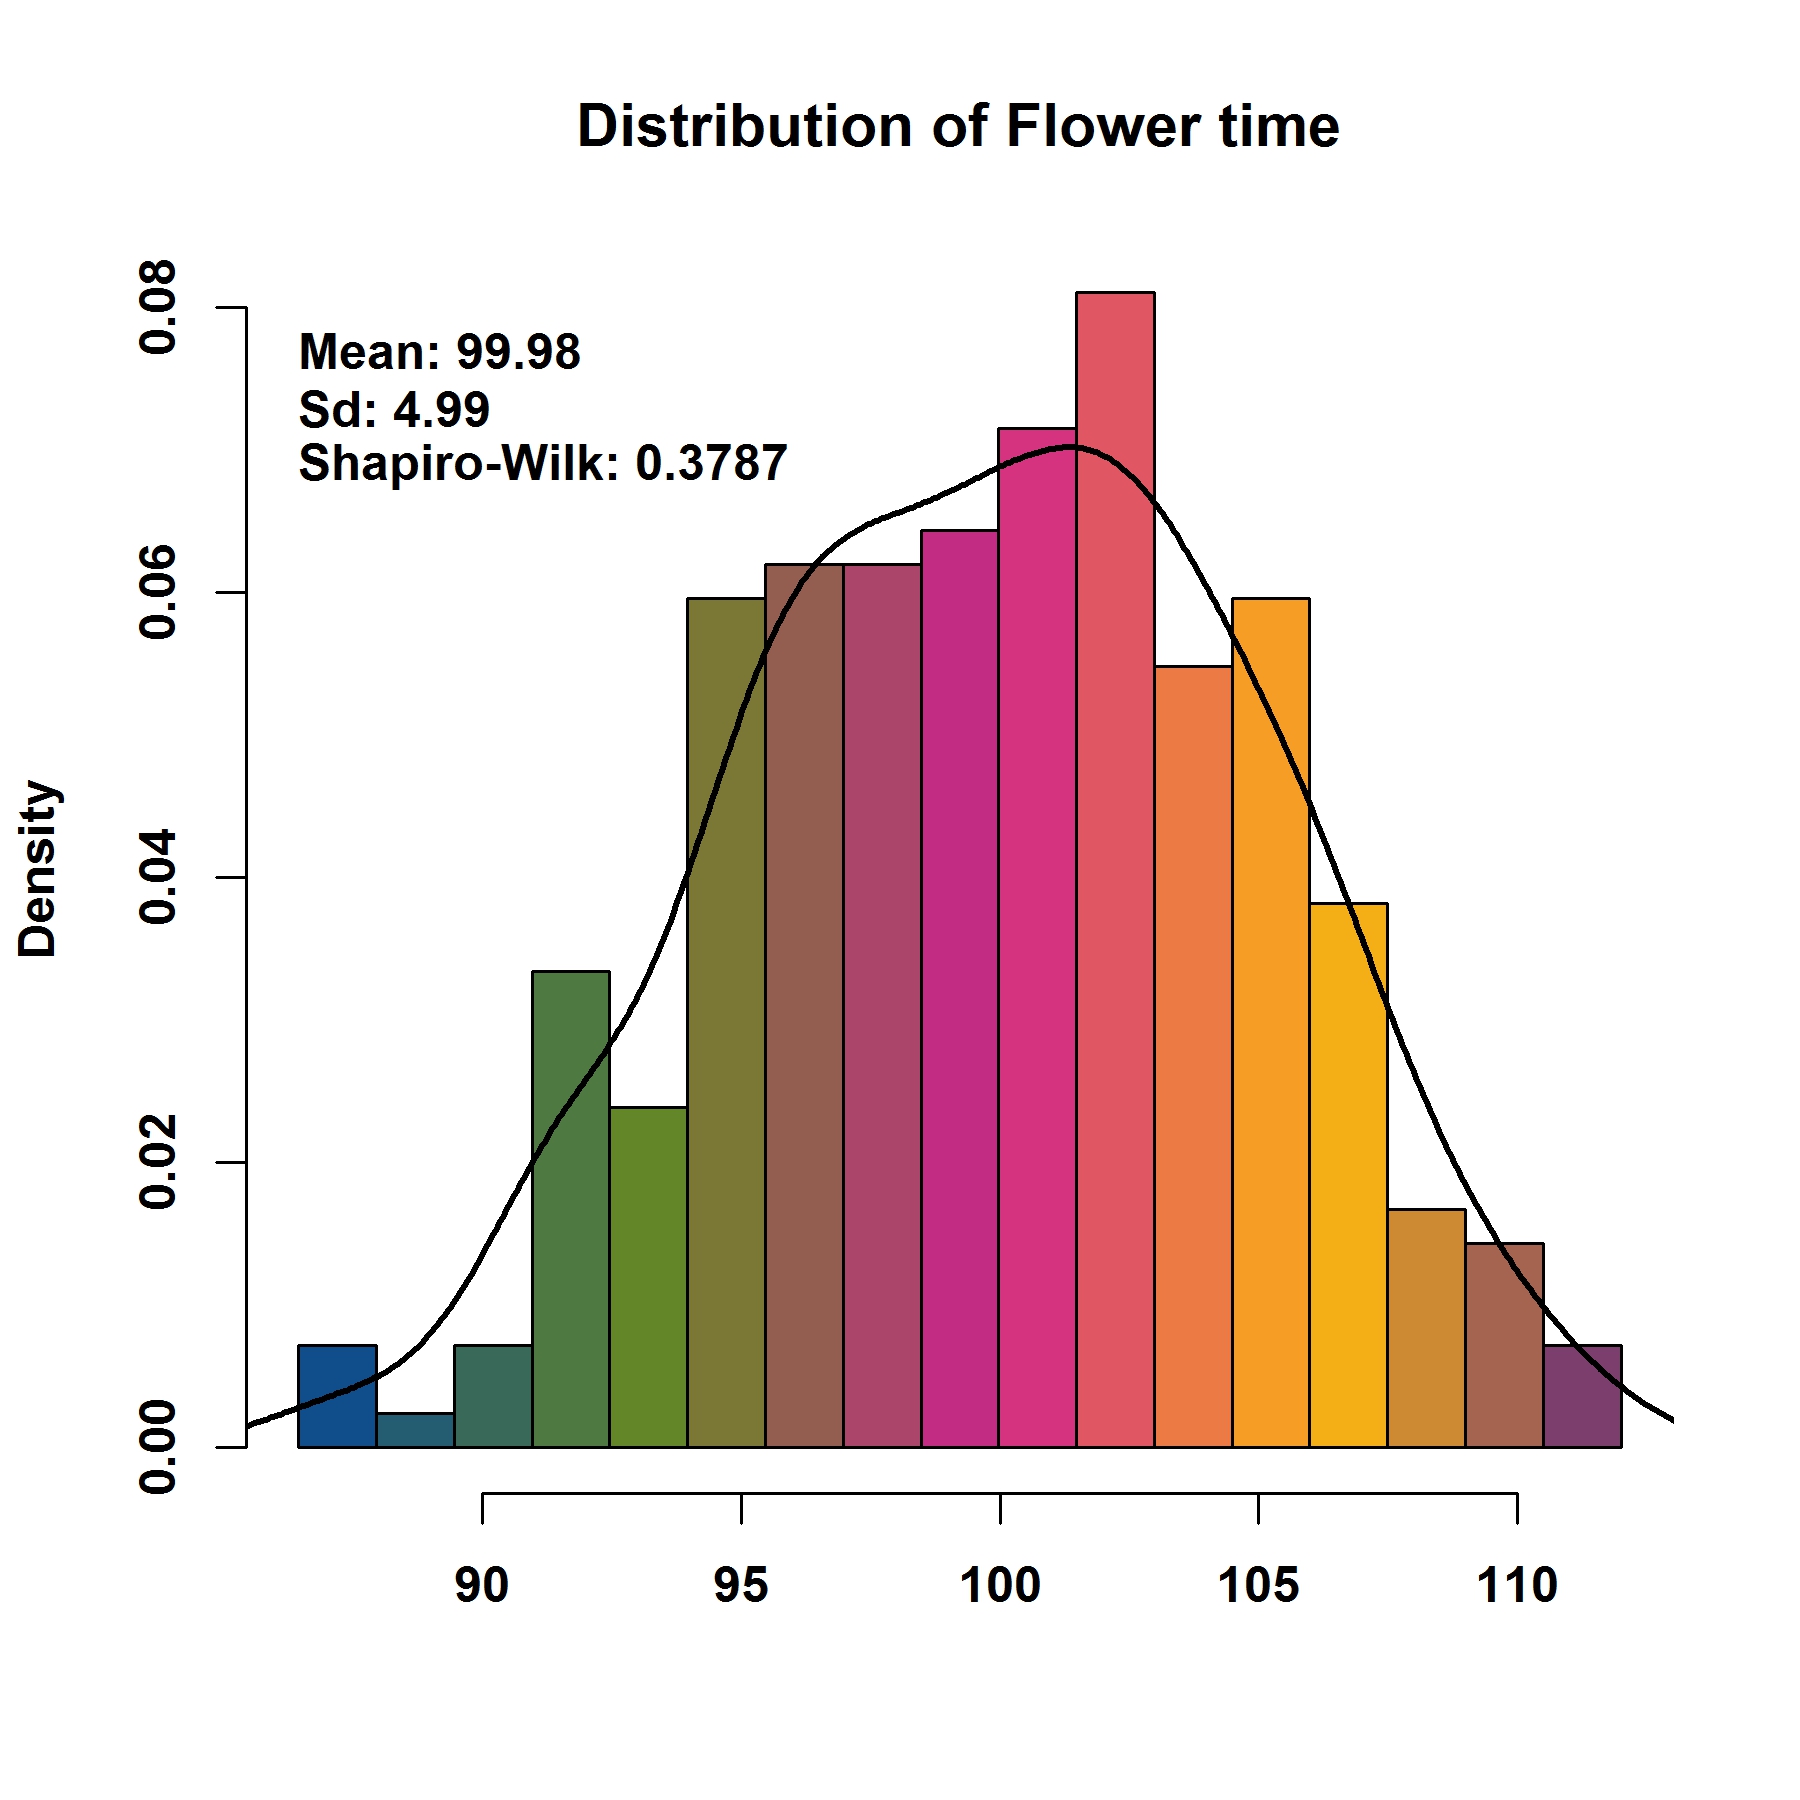
Phenotype distribution
phe, phenotype data
file.type, format of output figure
breakNum, number of breaking points for phenotype when plotting distribution
dpi, resolution of output figure
MVP.Hist(phe=phenotype, file.type="jpg", breakNum=18, dpi=300)
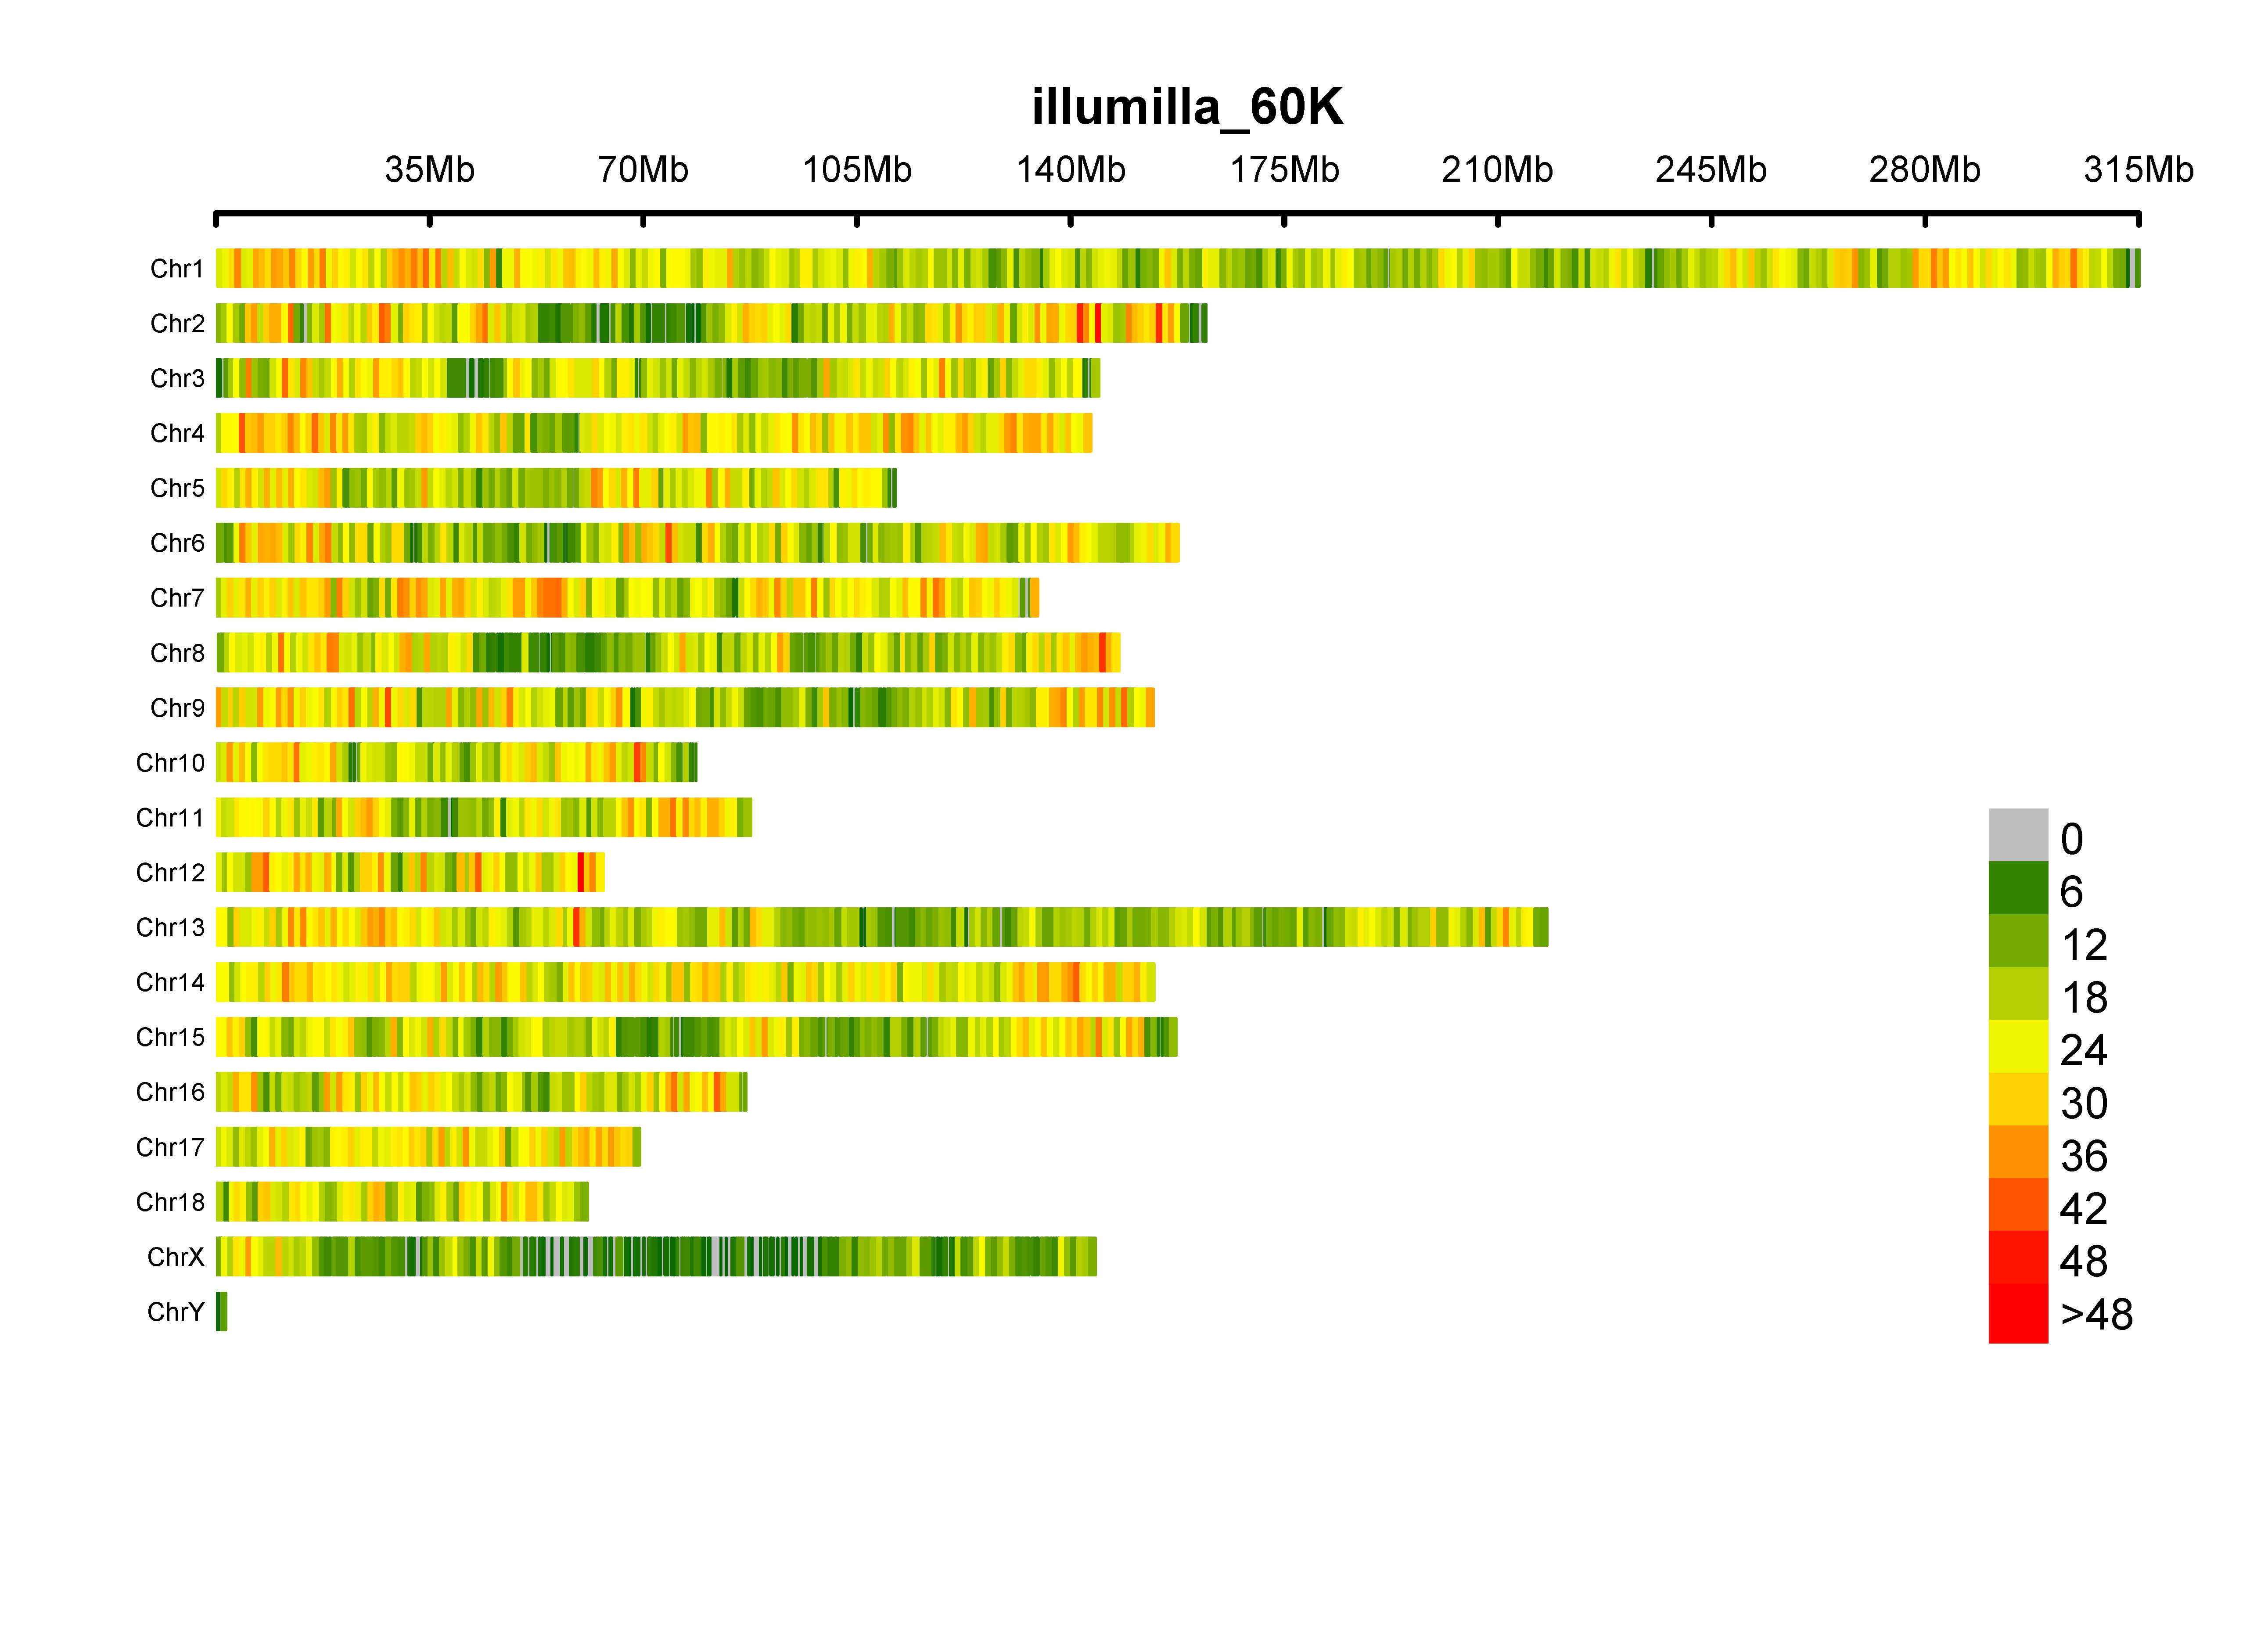
SNP-density plot
plot.type, four options ("d", "c", "m", "q"); if "d", draw SNP-density plot
bin.size, the window size for counting SNP number
bin.max, maximum SNP number, for windows, which has more SNPs than bin.max, will be painted in same color
col, colors for separating windows with different SNP density
file.type, format of output figure
dpi, resolution of output figure
MVP.Report(pig60K[, c(1:3)], plot.type="d", col=c("darkgreen", "yellow", "red"), file.type="jpg", dpi=300)
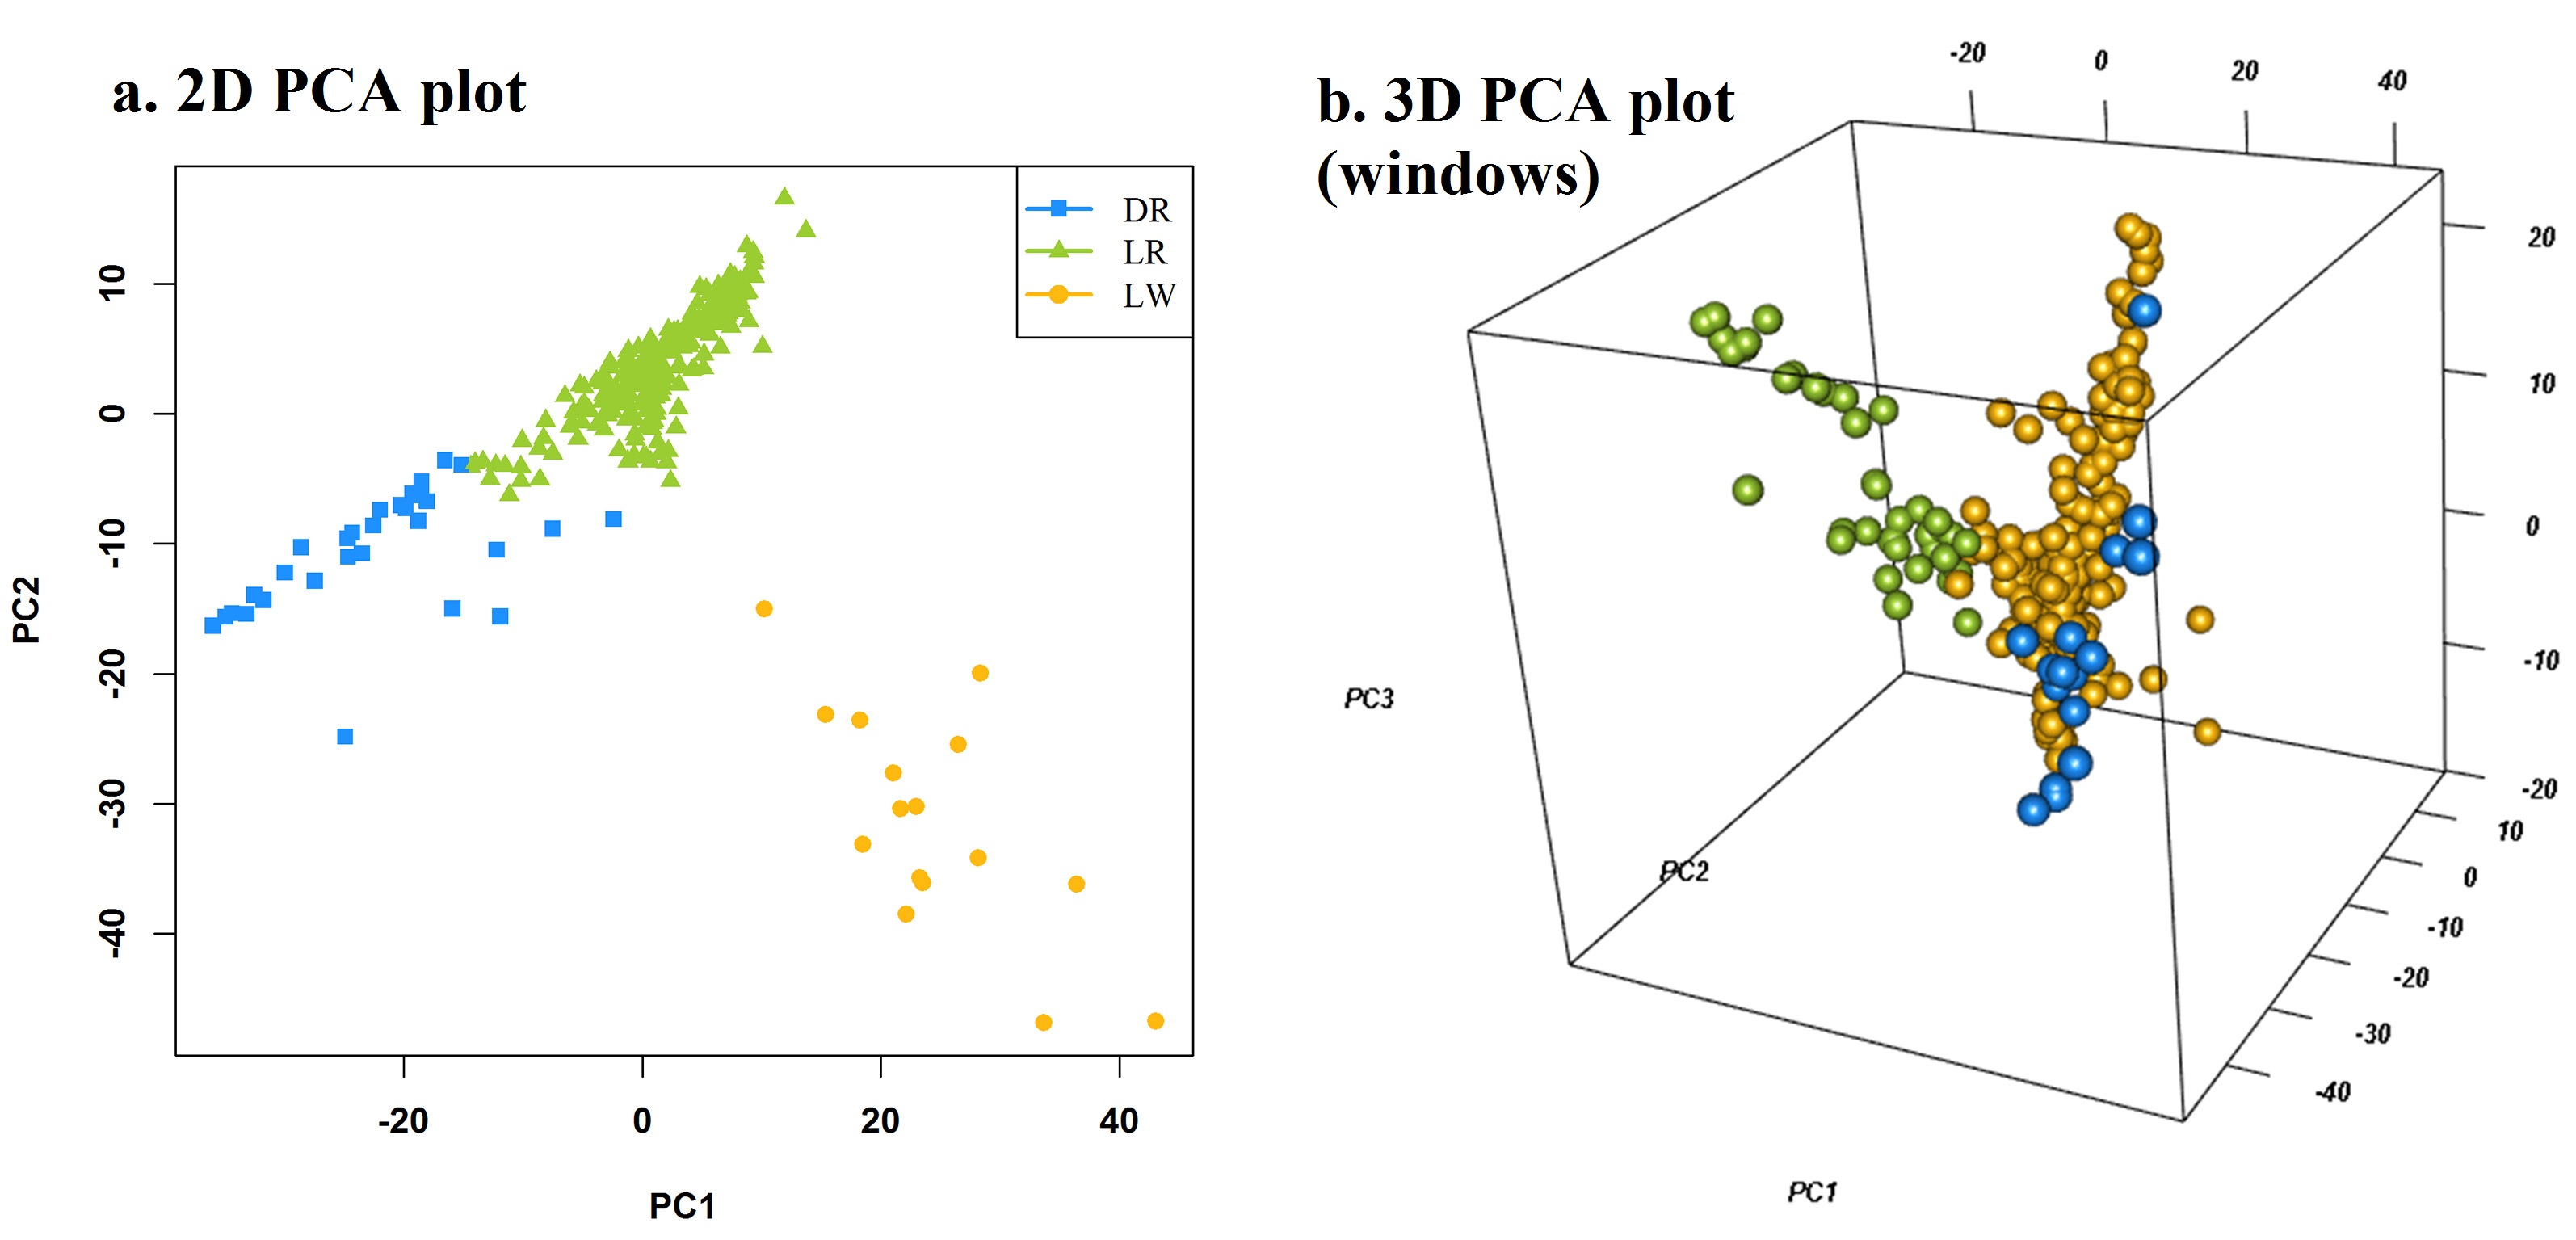
PCA plot
back to top
pca, the first three columns of principle components
Ncluster, cluster number
class, the class of all individuals, for example: "breed", "location"...
col, colors for each cluster
pch, point shape for each cluster
file.type, format of output figure
dpi, resolution of output figure
pca <- attach.big.matrix("mvp.pc.desc")[, 1:3]
#pca <- prcomp(t(as.matrix(genotype)))$x[, 1:3]
MVP.PCAplot(PCA=pca, Ncluster=3, class=NULL, col=c("red", "green", "yellow"), file.type="jpg")
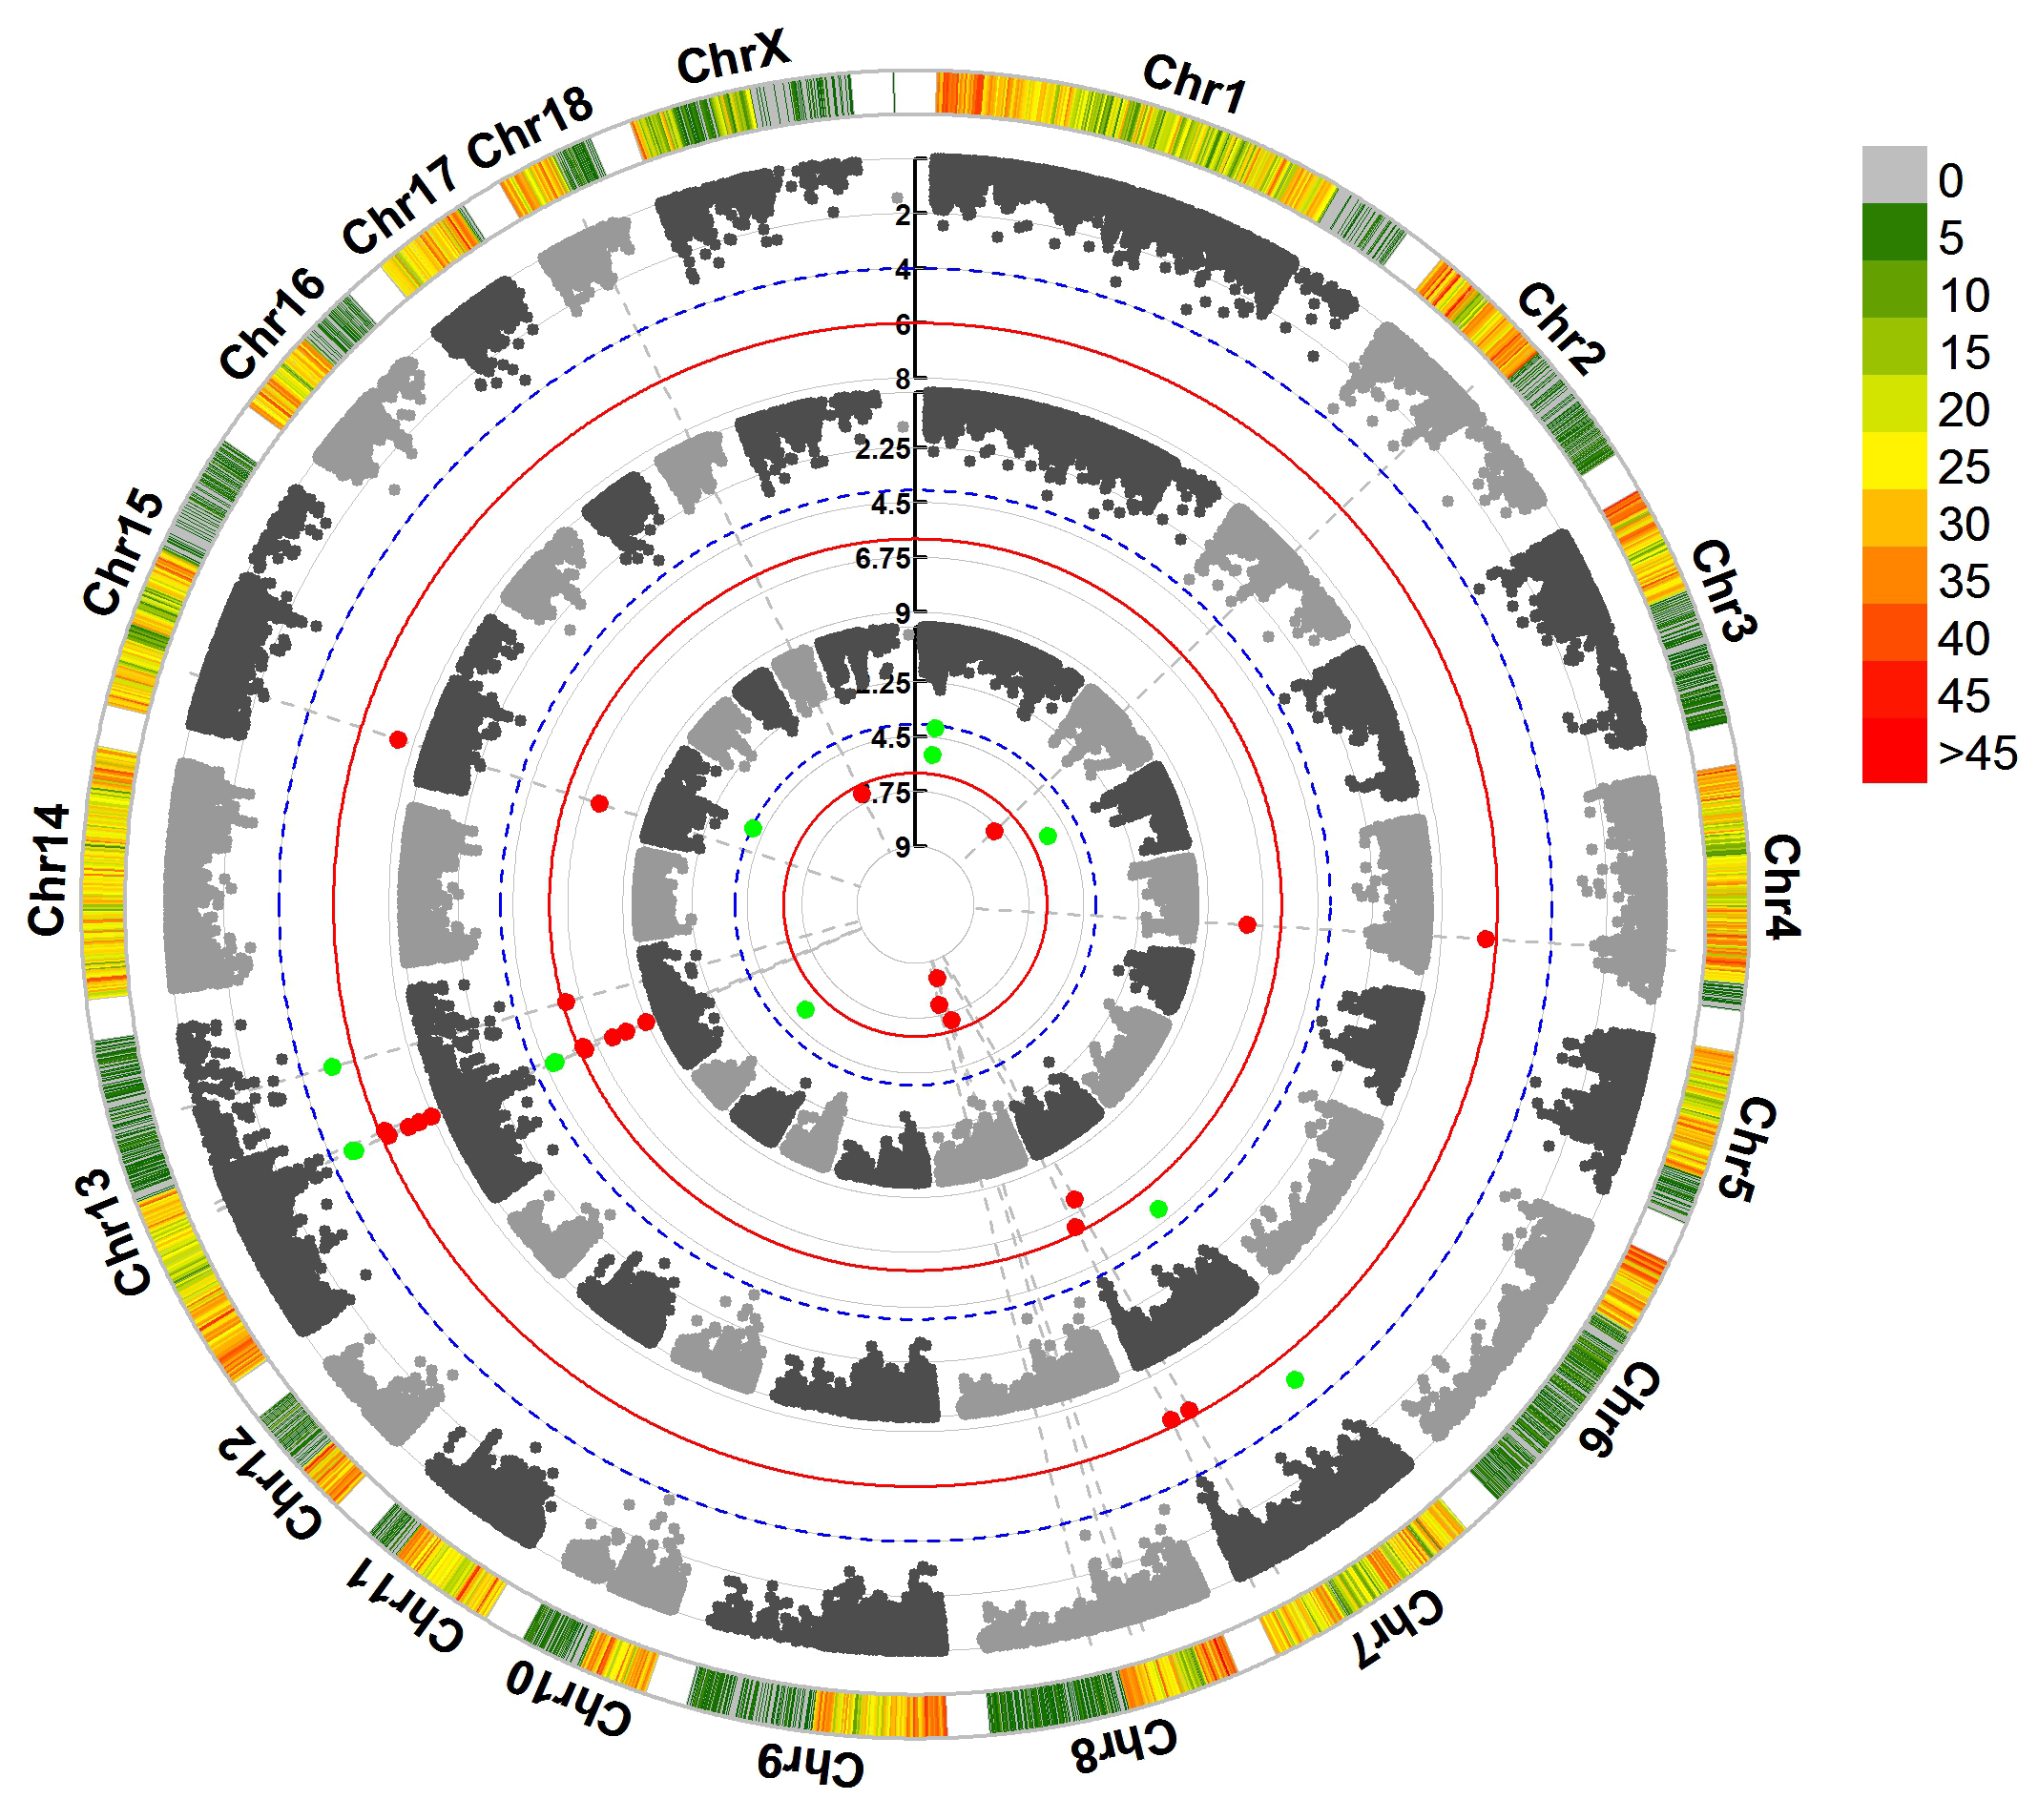
Manhattan plot in Circular fashion
back to top
For GWAS results:
> MVP.Report(pig60K,plot.type="c",chr.labels=paste("Chr",c(1:18,"X"),sep=""),r=0.4,cir.legend=TRUE,
        outward=FALSE,cir.legend.col="black",cir.chr.h=1.3,chr.den.col="black",file.type="jpg",
        memo="",dpi=300)
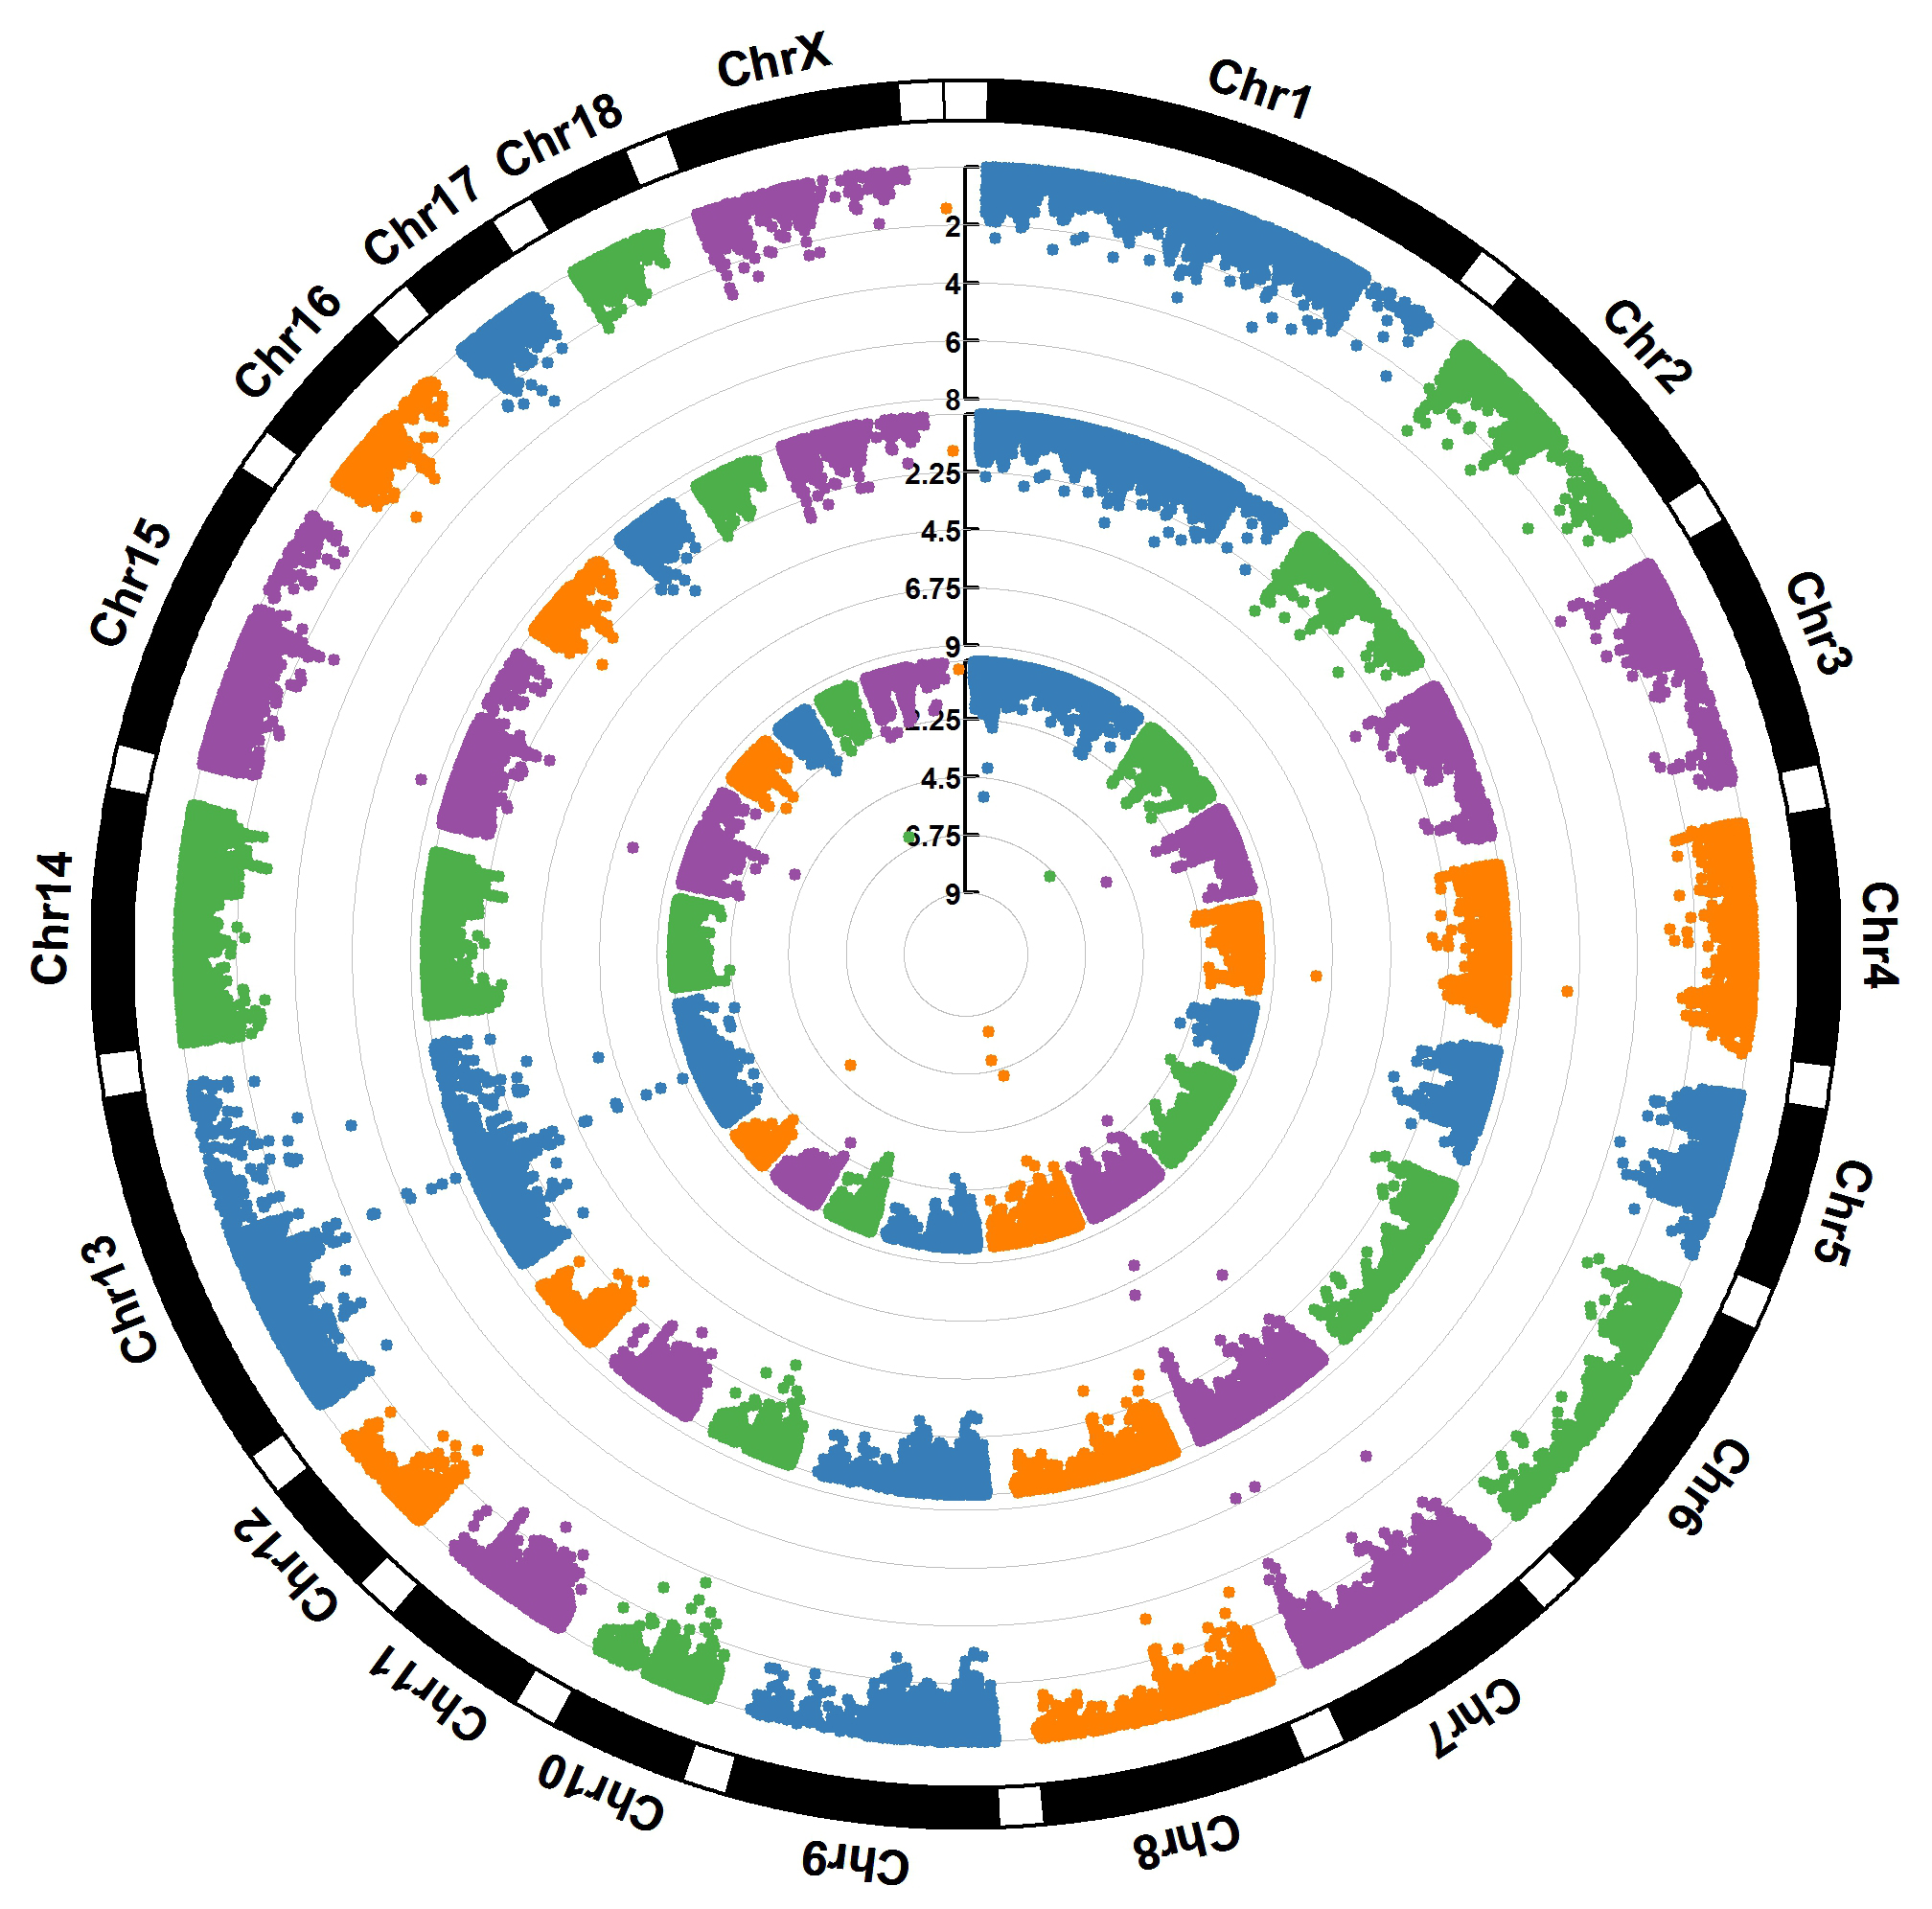
> MVP.Report(pig60K,plot.type="c",r=0.4,col=c("grey30","grey60"),chr.labels=paste("Chr",c(1:18,"X"),sep=""),
      threshold=c(1e-6,1e-4),cir.chr.h=1.5,amplify=TRUE,threshold.lty=c(1,2),threshold.col=c("red",
      "blue"),signal.line=1,signal.col=c("red","green"),chr.den.col=c("darkgreen","yellow","red"),
      bin.size=1e6,outward=FALSE,file.type="jpg",memo="",dpi=300)

#Note:
1. if signal.line=NULL, the lines that crosse circles won't be added.
2. if the length of parameter 'chr.den.col' is not equal to 1, SNP density that counts
   the number of SNP within given size('bin.size') will be plotted around the circle.
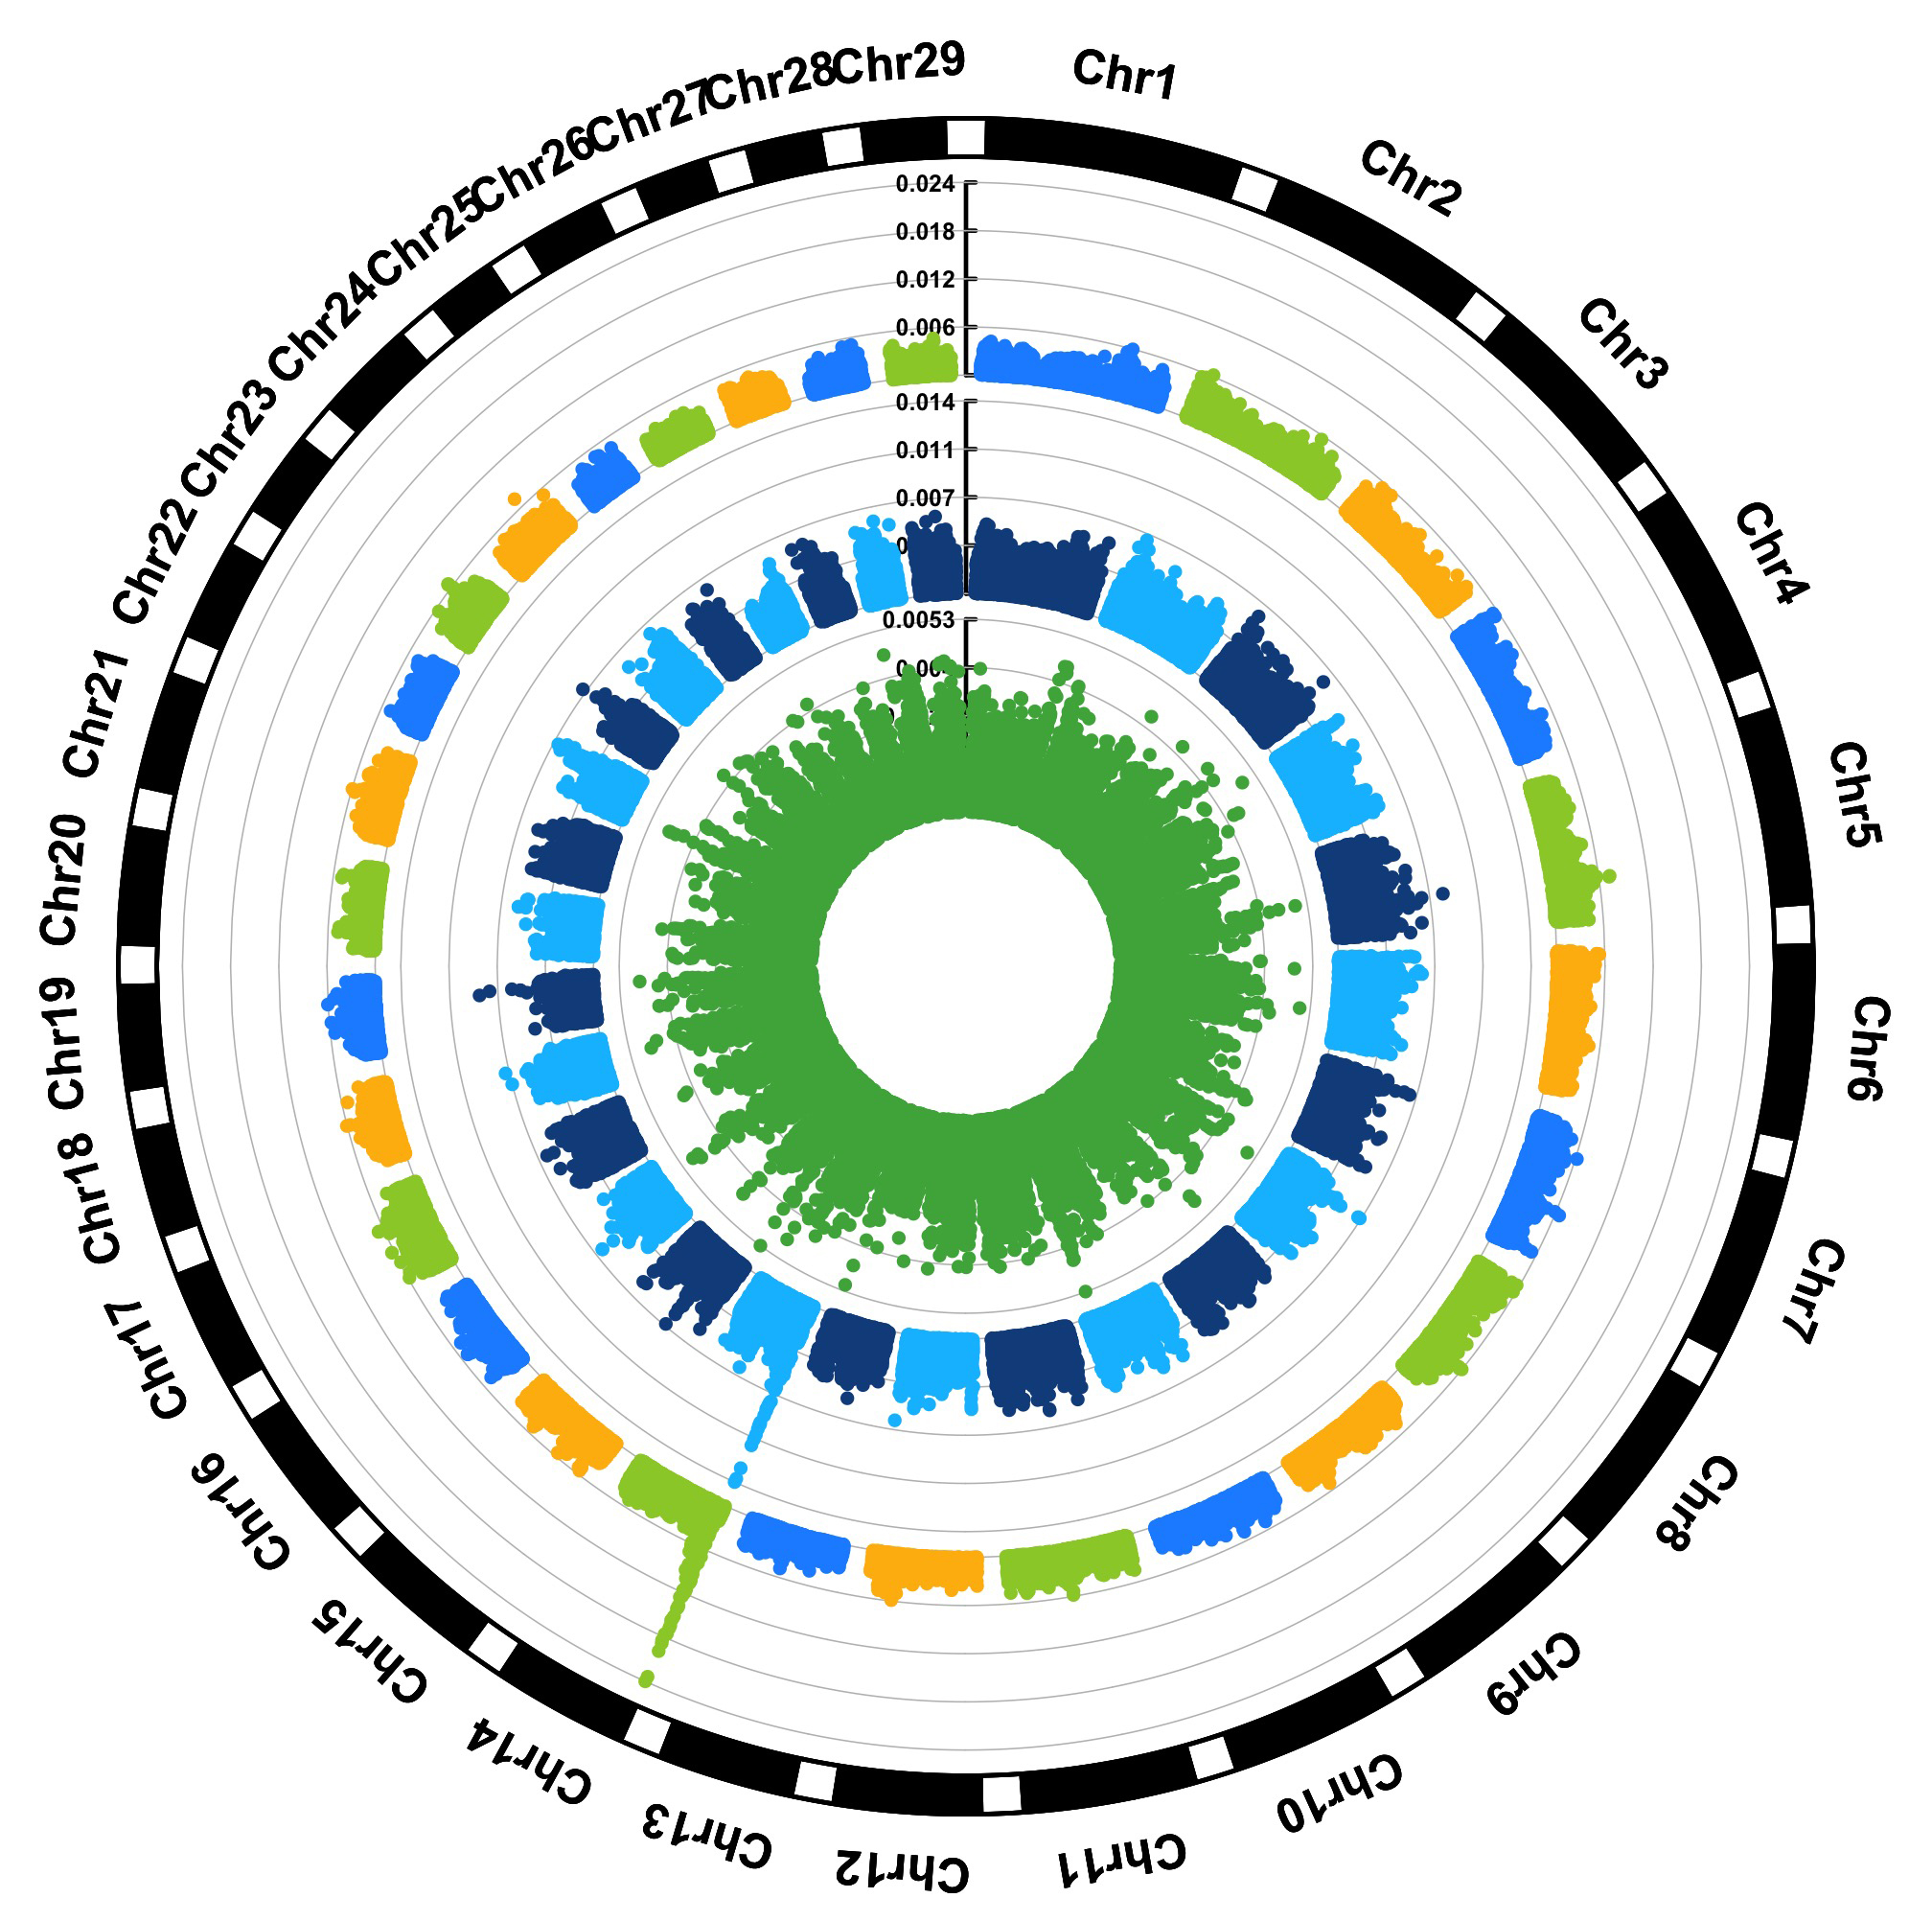
For GS/GP results:
> MVP.Report(cattle50K,plot.type="c",LOG10=FALSE,outward=TRUE,matrix(c("#4DAF4A",NA,NA,"dodgerblue4",
            "deepskyblue",NA,"dodgerblue1", "olivedrab3", "darkgoldenrod1"), nrow=3, byrow=TRUE),
            chr.labels=paste("Chr",c(1:29),sep=""),threshold=NULL,r=1.2,cir.chr.h=1.5,cir.legend.cex=0.5,
            cir.band=1,file.type="jpg", memo="",dpi=300,chr.den.col="black")

#Note:
Parameter 'col' can be either vector or matrix, if a matrix, each trait can be plotted in different colors.
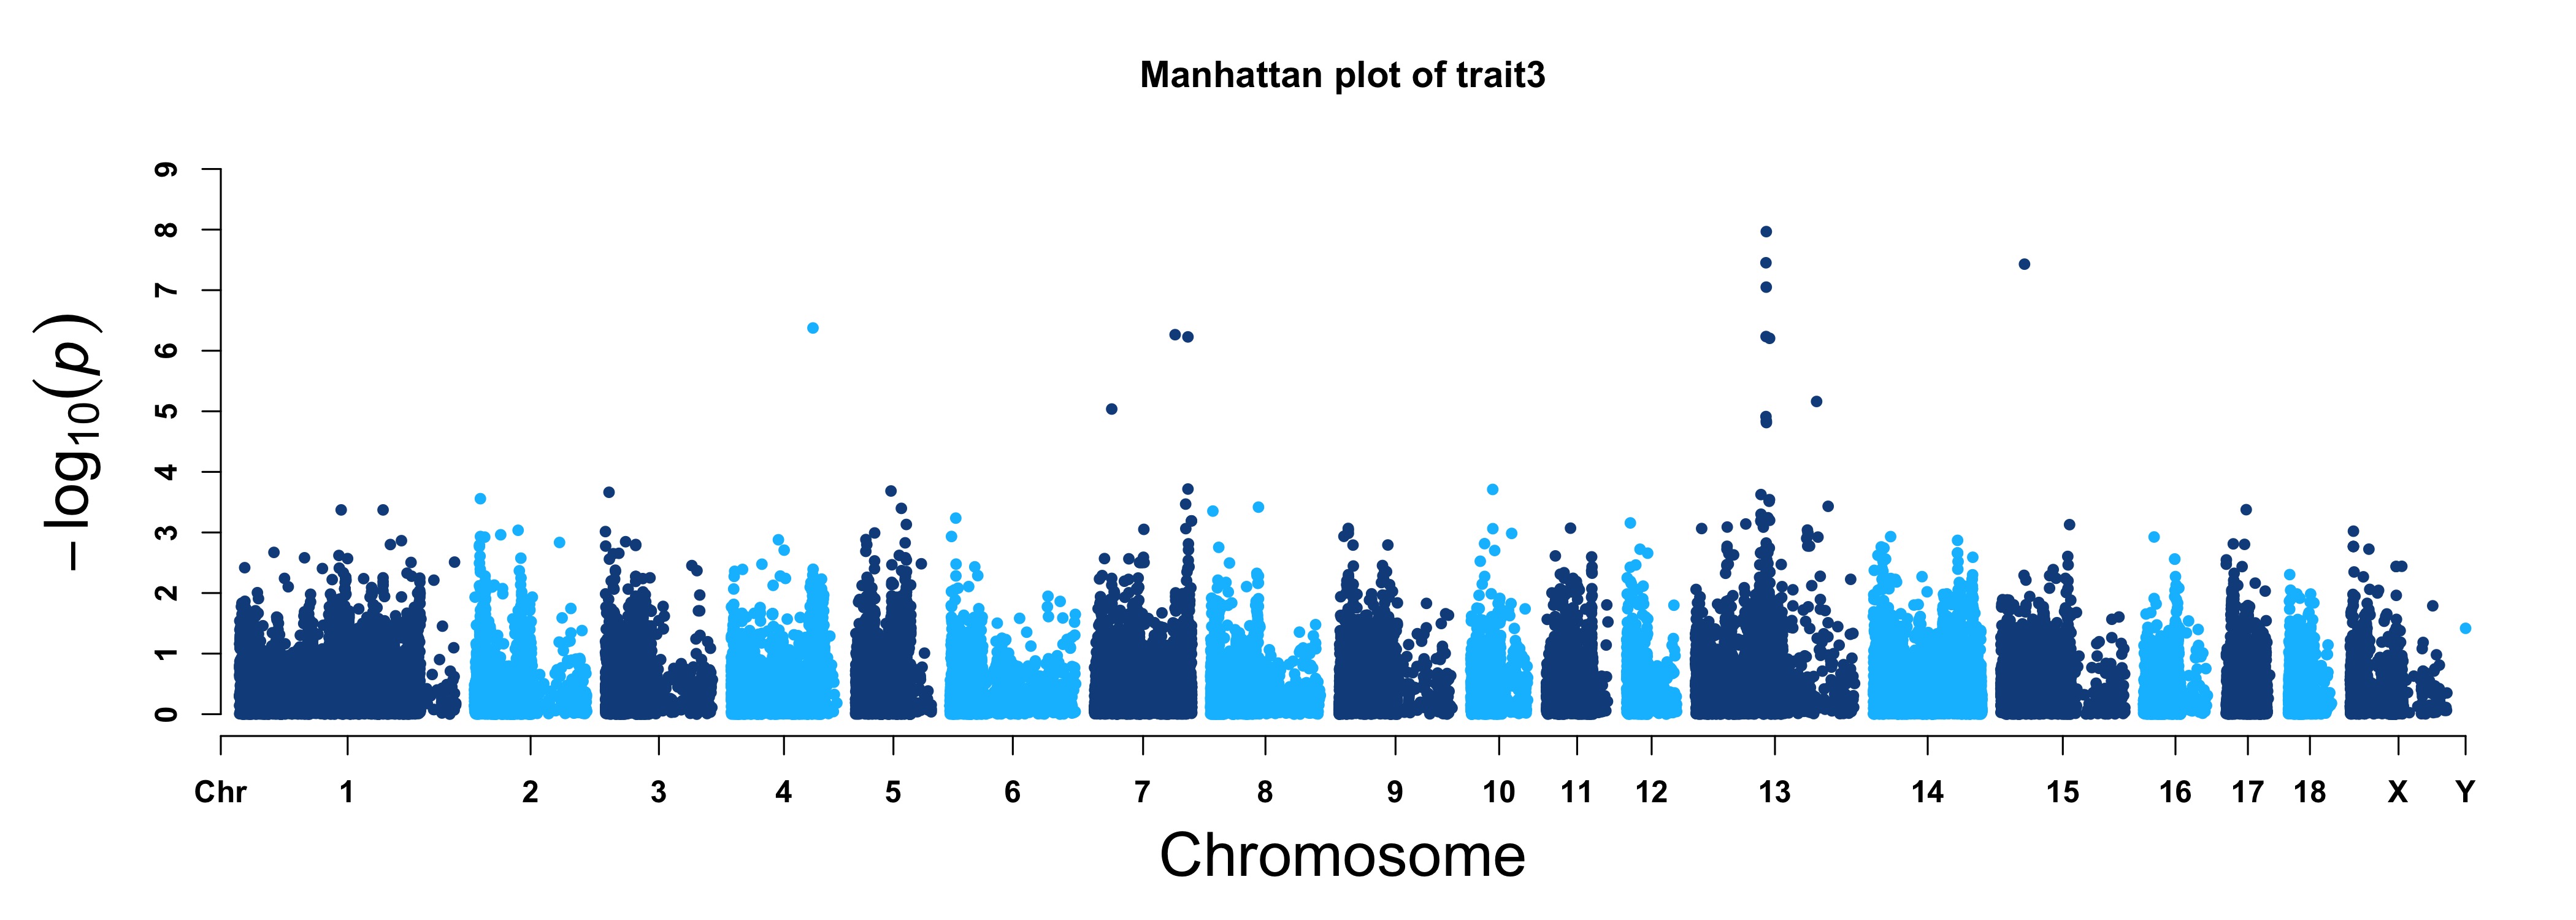
Manhattan plot in Rectangular fashion for single trait or method
back to top
For GWAS results:
> MVP.Report(pig60K,plot.type="m",LOG10=TRUE,threshold=NULL,col=c("dodgerblue4","deepskyblue"), cex=0.7,
            chr.den.col=NULL,file.type="jpg",memo="",dpi=300)
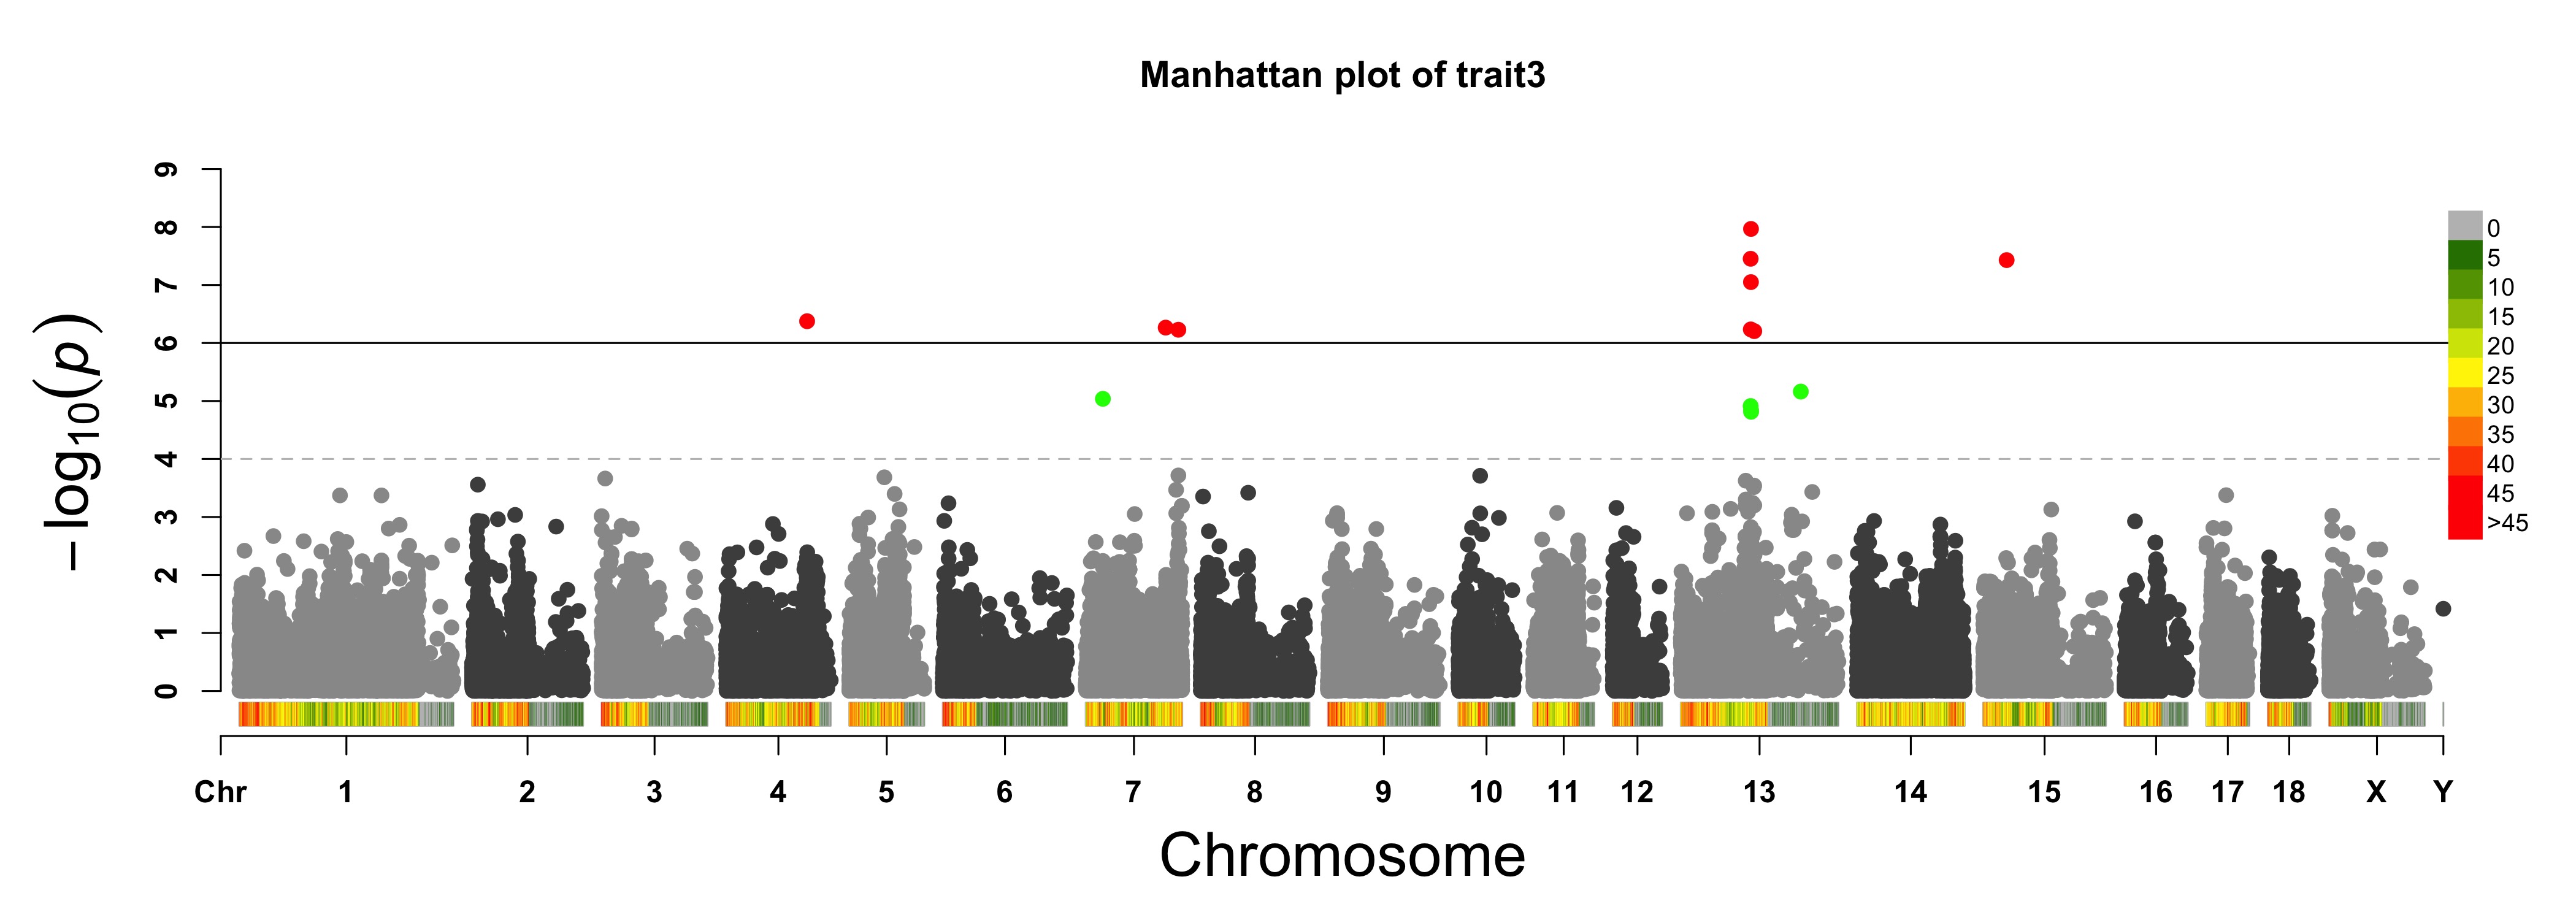
> MVP.Report(pig60K, plot.type="m", col=c("dodgerblue4","deepskyblue"), LOG10=TRUE, ylim=NULL,
        threshold=c(1e-6,1e-4), threshold.lty=c(1,2), threshold.lwd=c(1,1), threshold.col=c("black",
        "grey"), amplify=TRUE,chr.den.col=NULL, signal.col=c("red","green"), signal.cex=c(1,1),
        signal.pch=c(19,19),file.type="jpg",memo="",dpi=300)
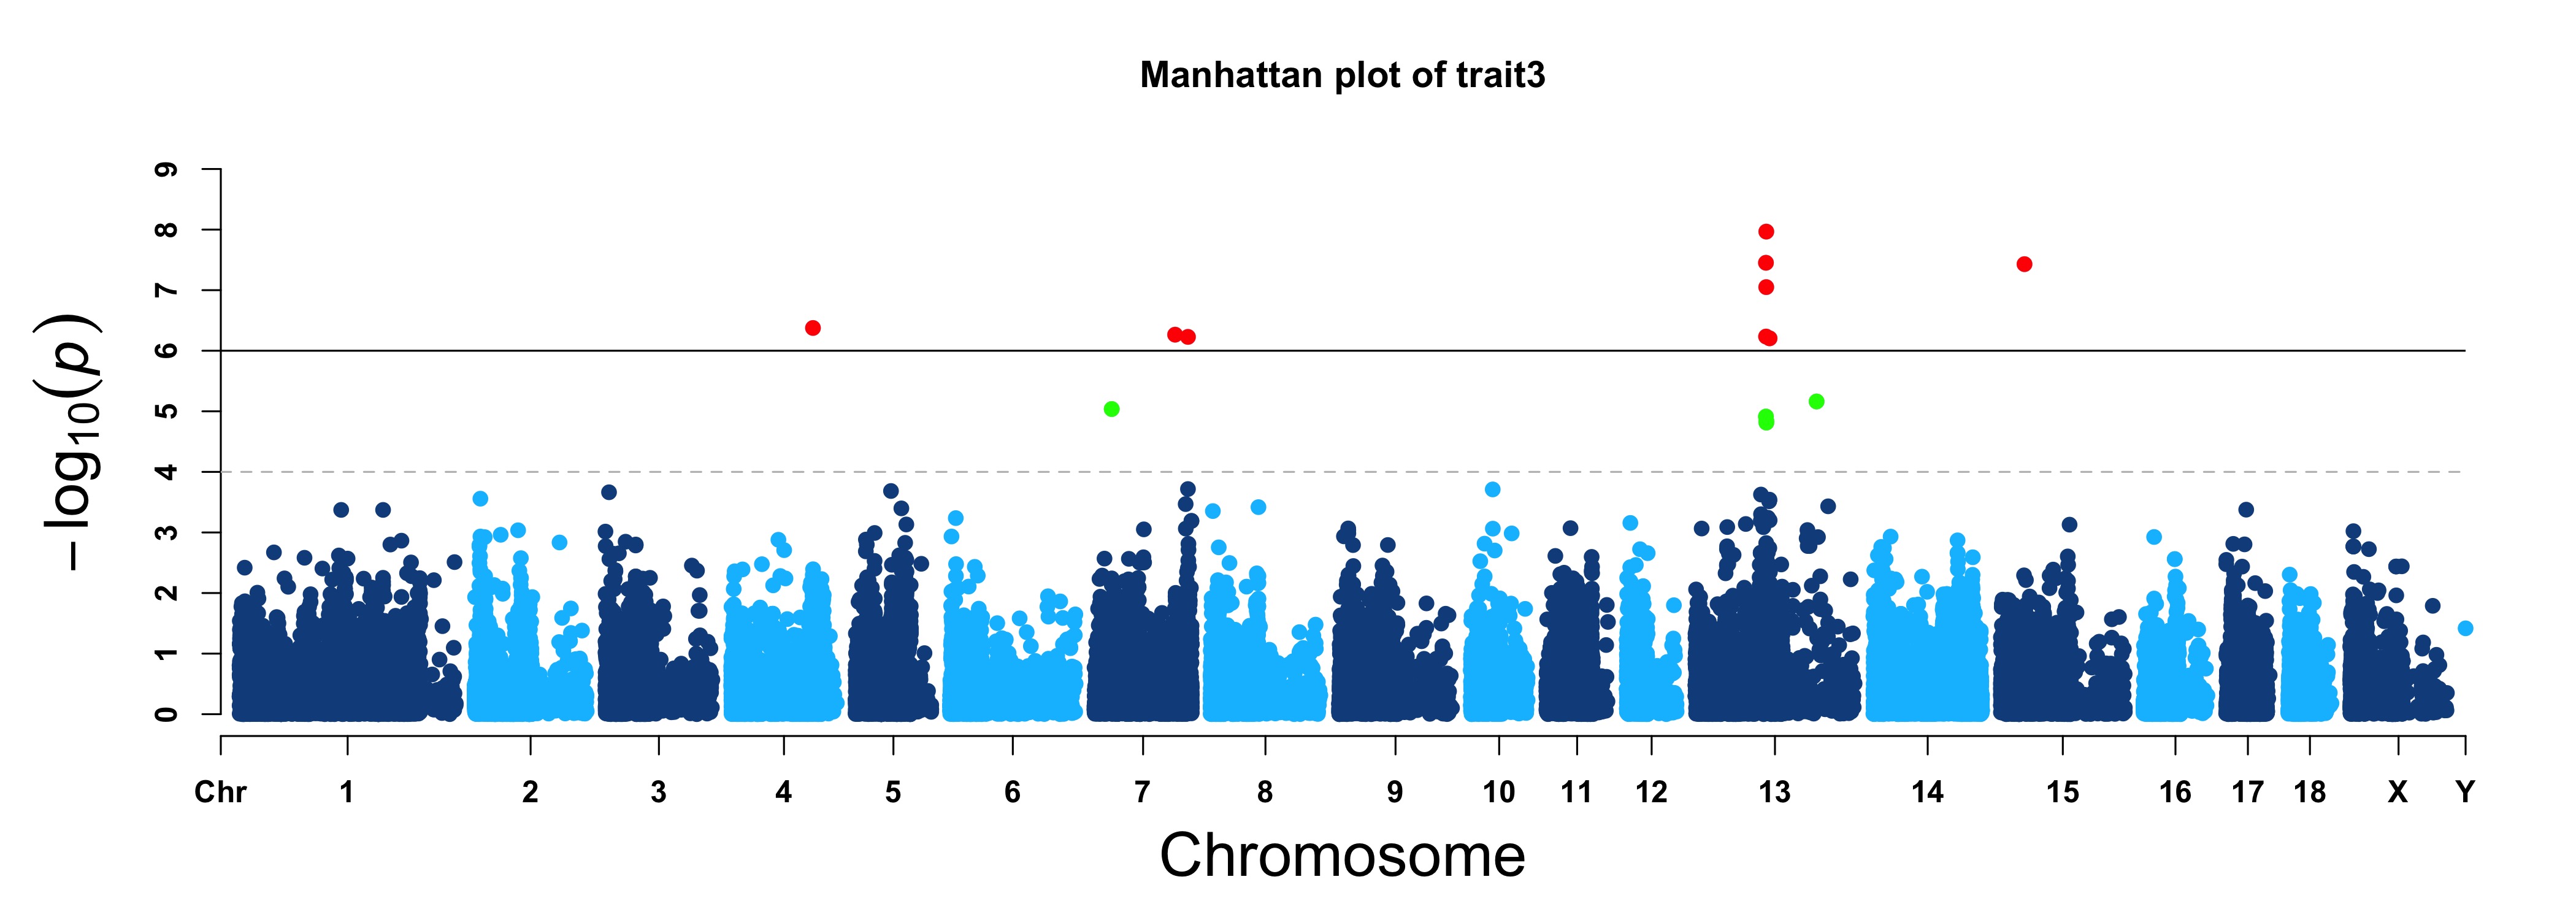
> MVP.Report(pig60K, plot.type="m", LOG10=TRUE, ylim=NULL, threshold=c(1e-6,1e-4),threshold.lty=c(1,2),
        col=c("grey60","grey30"), threshold.lwd=c(1,1), threshold.col=c("black","grey"), amplify=TRUE,
        chr.den.col=c("darkgreen", "yellow", "red"),bin.size=1e6,signal.col=c("red","green"),
        signal.cex=c(1,1),signal.pch=c(19,19),file.type="jpg",memo="",dpi=300)

#Note:
if the length of parameter 'chr.den.col' is bigger than 1, SNP density that counts
   the number of SNP within given size('bin.size') will be plotted.
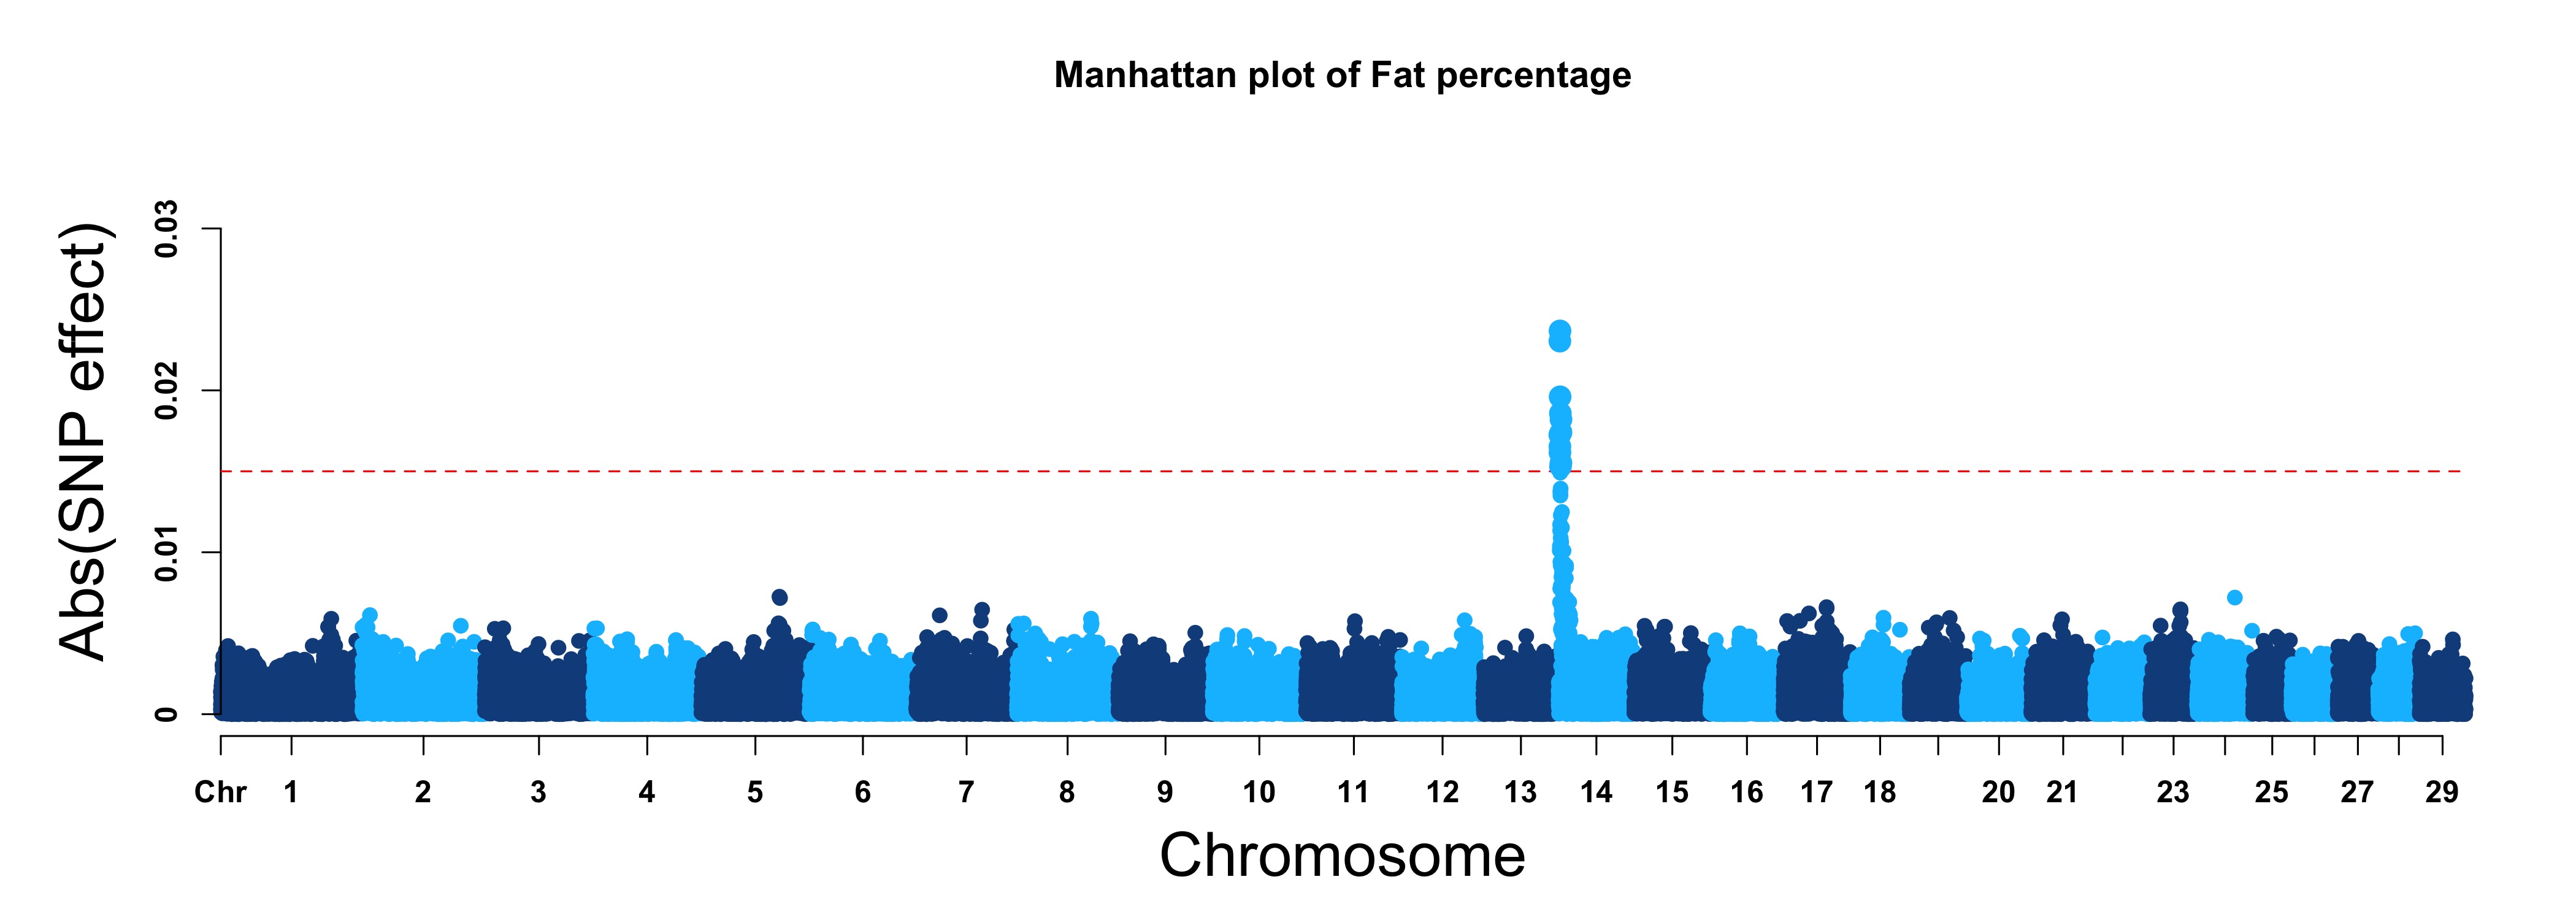
For GS/GP results:
> MVP.Report(cattle50K, plot.type="m", band=0, LOG10=FALSE, ylab="Abs(SNP effect)",threshold=0.015,
        threshold.lty=2, threshold.lwd=1, threshold.col="red", amplify=TRUE, signal.col=NULL,
        col=c("dodgerblue4","deepskyblue"), chr.den.col=NULL, file.type="jpg",memo="",dpi=300)

#Note:
if signal.col=NULL, the significant SNPs will be plotted with original colors.
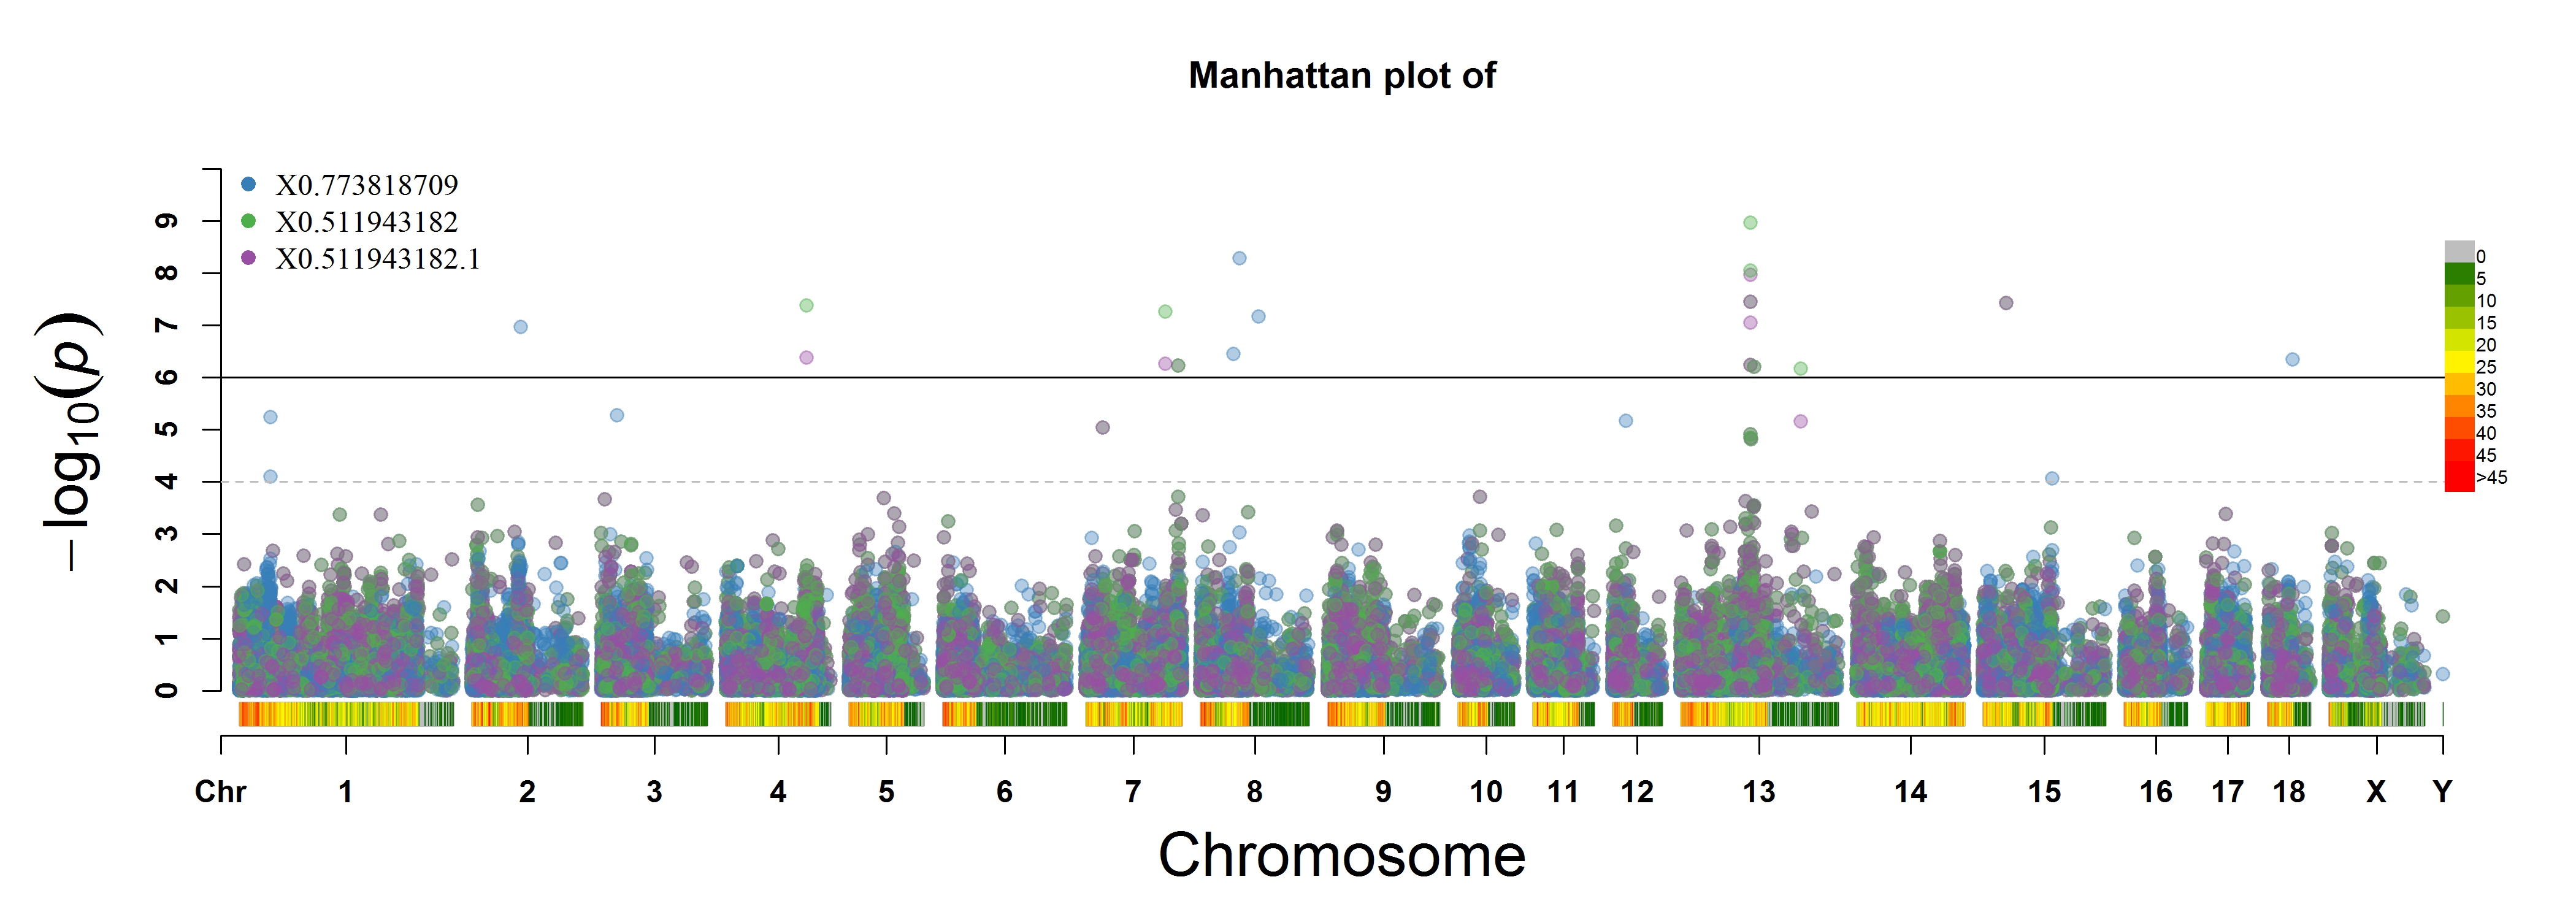
Manhattan plot in Rectangular fashion for multiple traits or methods
> MVP.Report(pig60K, plot.type="m", multracks=TRUE, threshold=c(1e-6,1e-4),threshold.lty=c(1,2),
        threshold.lwd=c(1,1), threshold.col=c("black","grey"), amplify=TRUE,bin.size=1e6,
        chr.den.col=c("darkgreen", "yellow", "red"), signal.col=c("red","green"),signal.cex=c(1,1),
        file.type="jpg",memo="",dpi=300)
a. all traits in a axes:
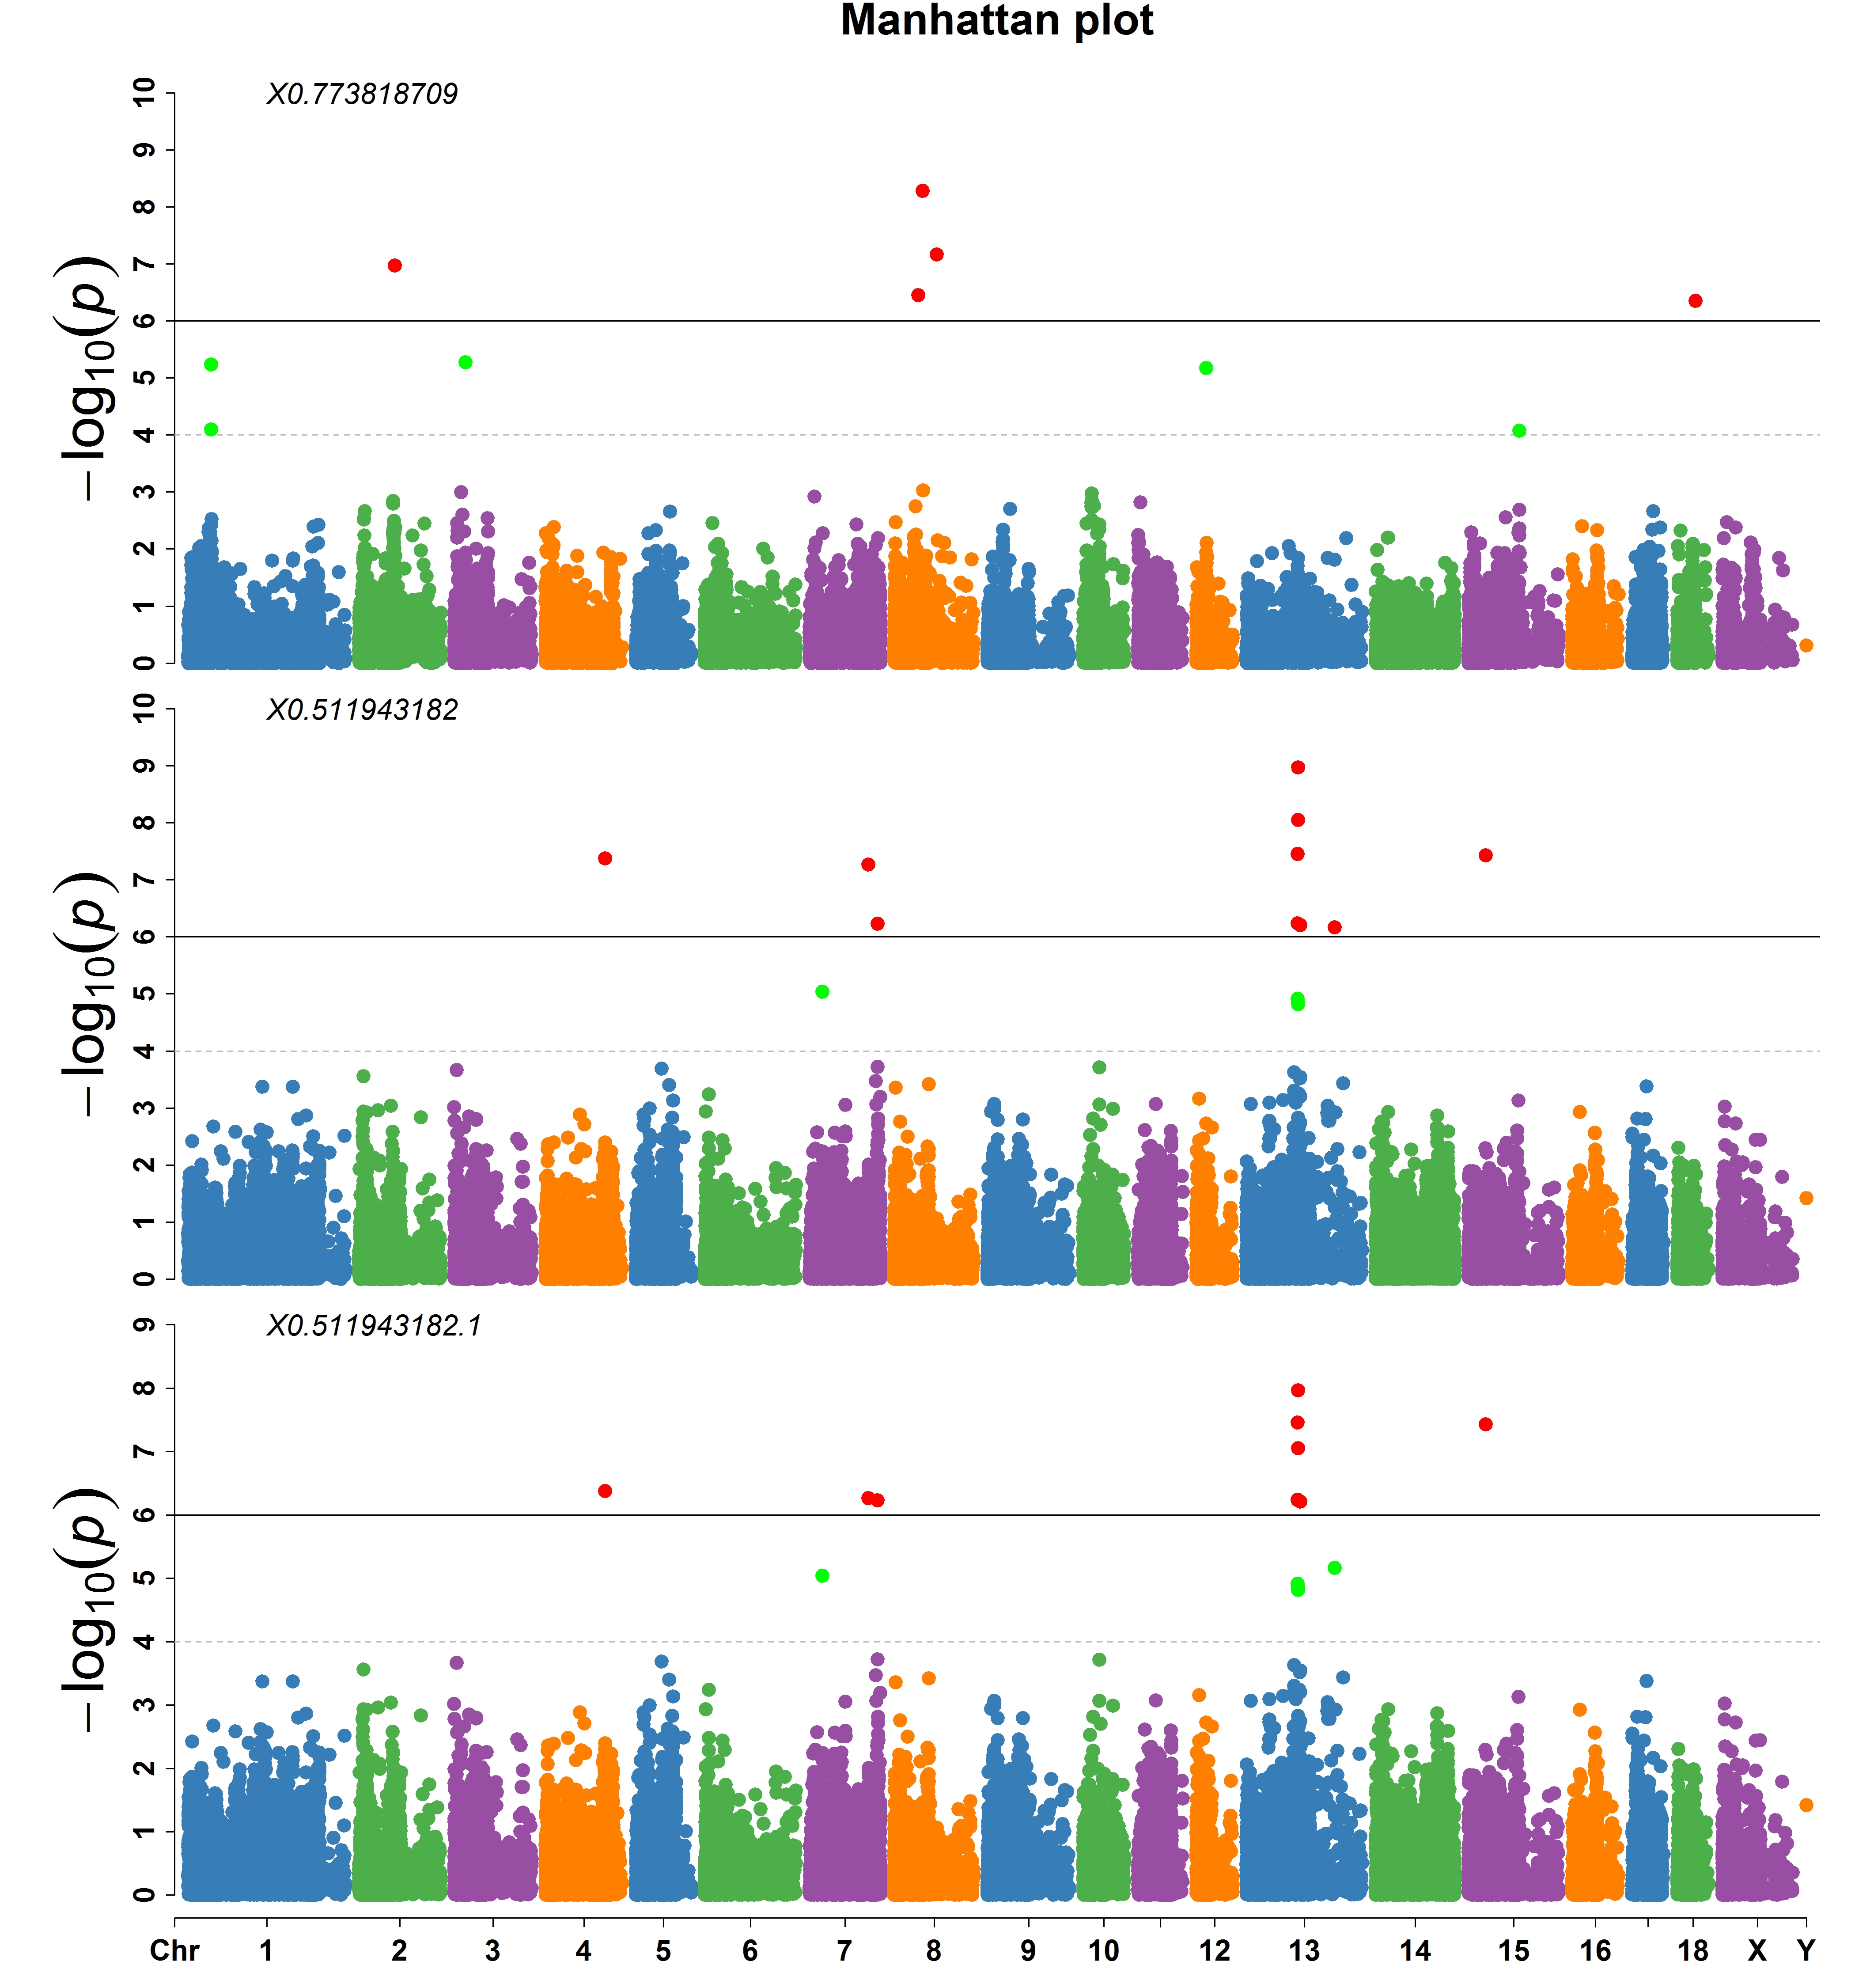
b. all traits in separated axes:
Q-Q plot for single trait or method
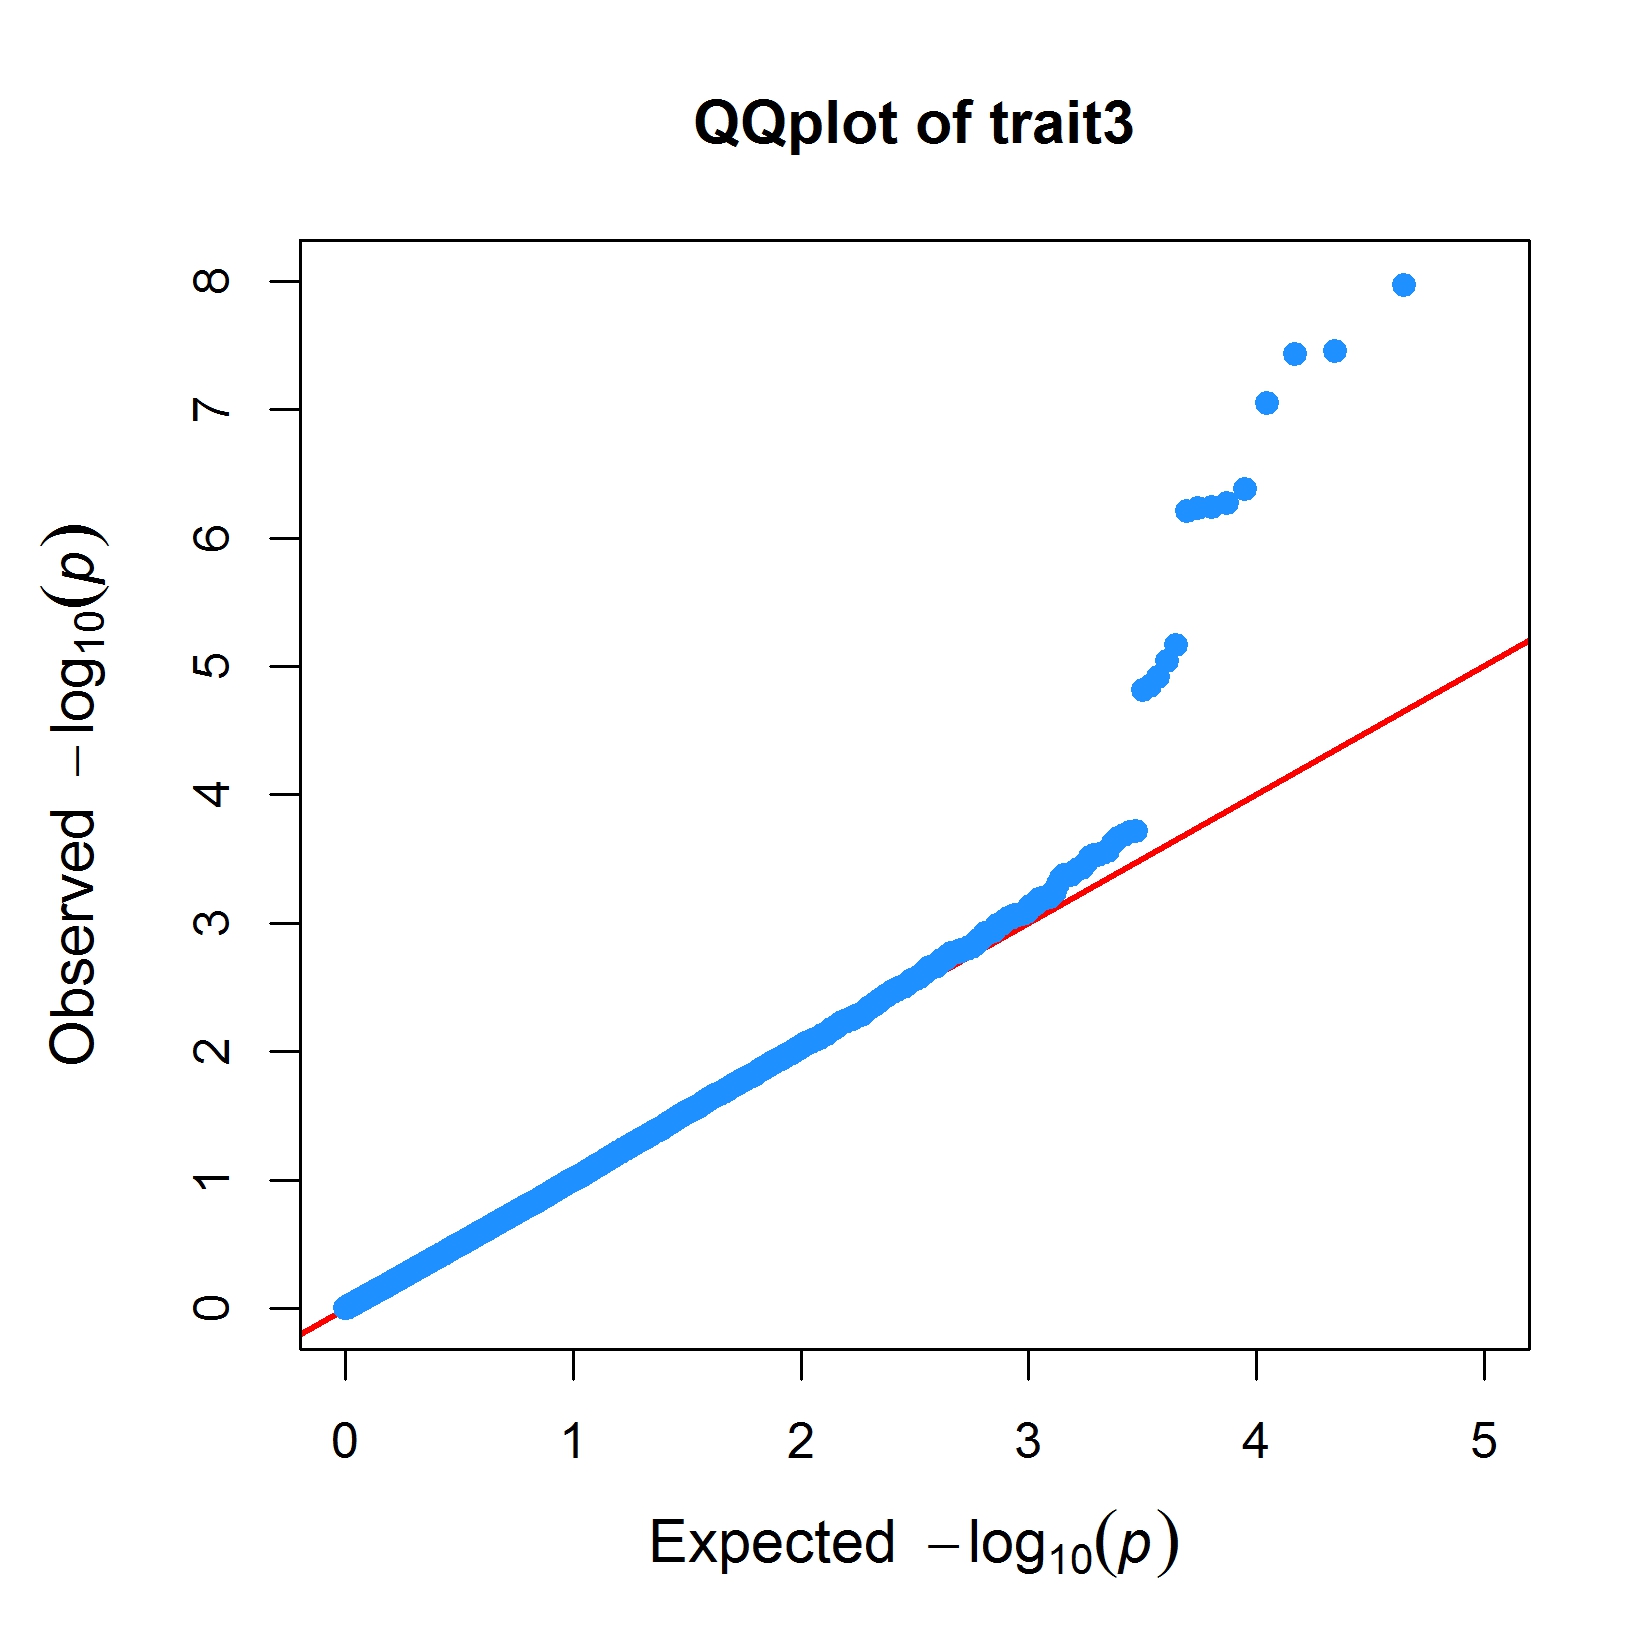
> MVP.Report(pig60K,plot.type="q",conf.int.col=NULL,box=TRUE,file.type="jpg",memo="",dpi=300)
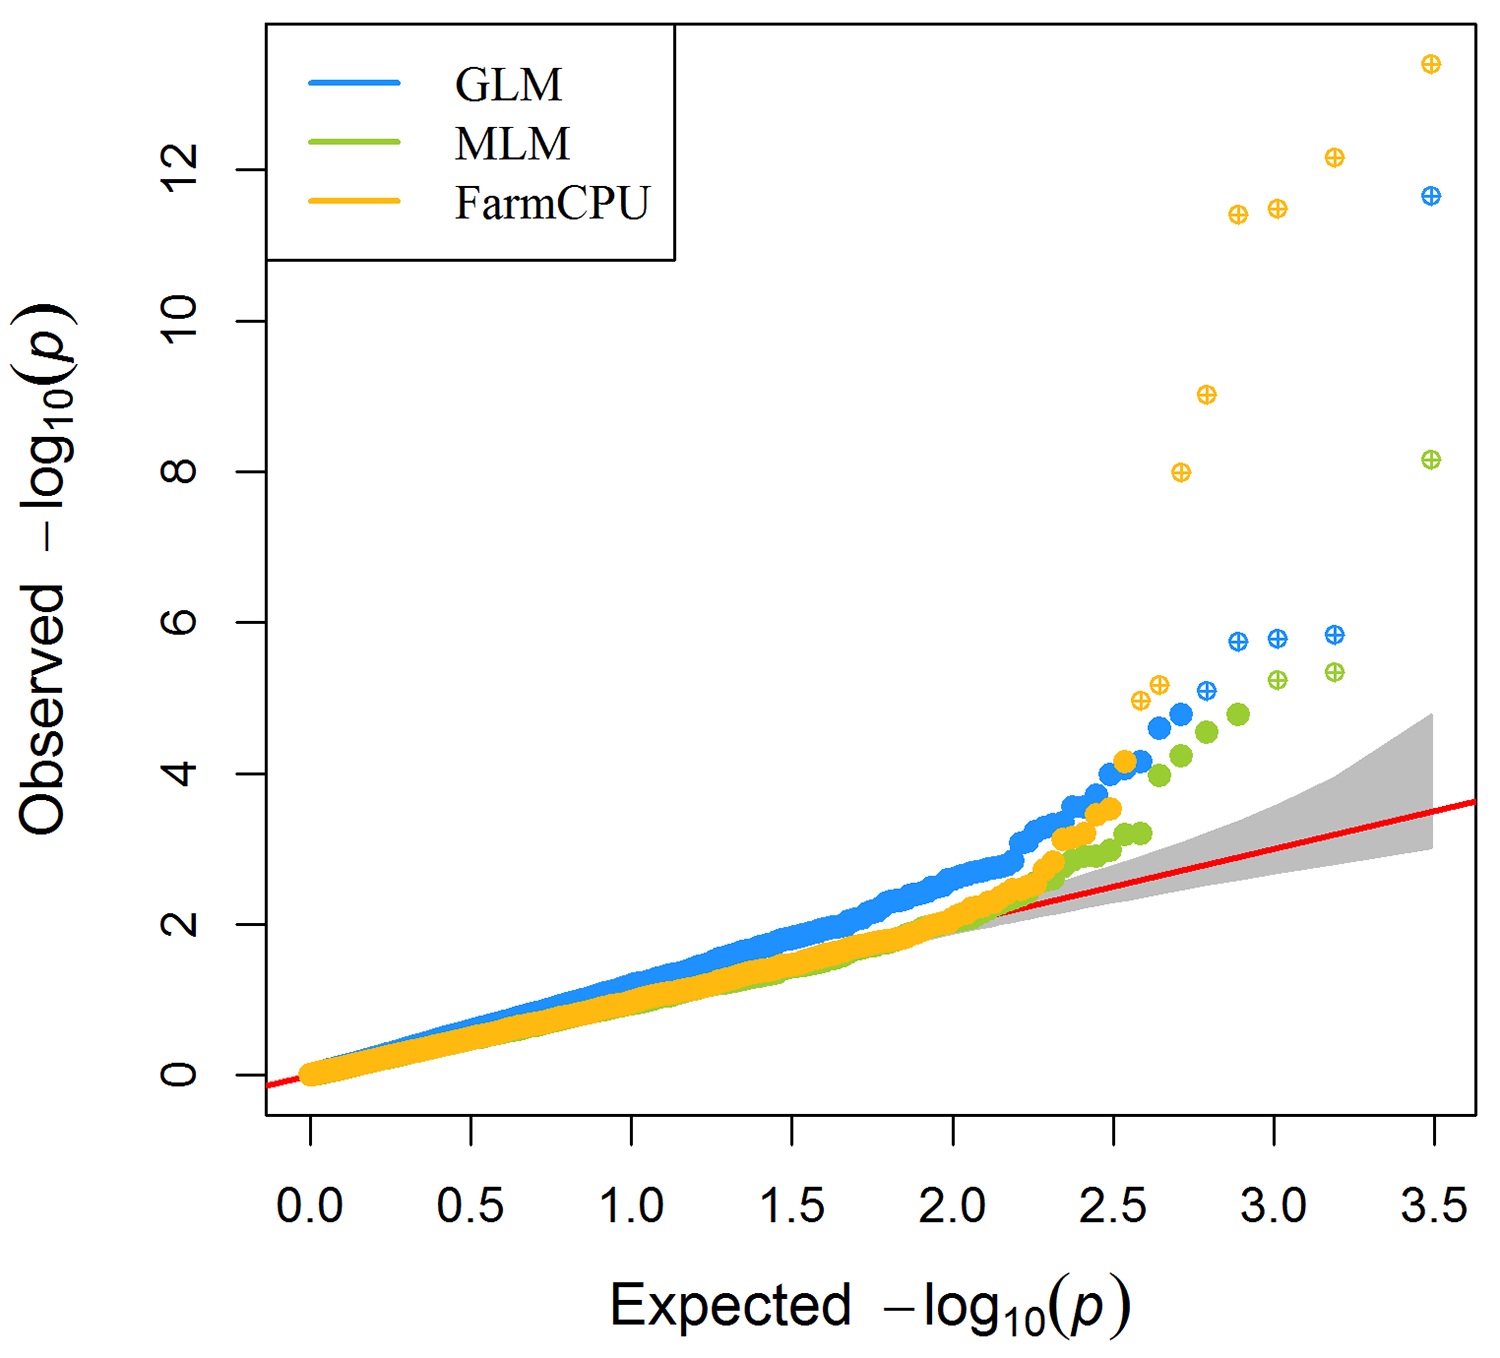
Q-Q plot for multiple traits or methods
> MVP.Report(imMVP,plot.type="q",col=c("dodgerblue1", "olivedrab3", "darkgoldenrod1"),threshold=1e6,
        signal.pch=19,signal.cex=1.5,signal.col="red",conf.int.col="grey",box=FALSE,multracks=
        TRUE,file.type="jpg",memo="",dpi=300)
Citation
For MVP (Please cite MVP package for all the functions):
Yin L, Zhang H, Tang Z, Xu J, Yin D, Zhang Z, Yuan X, Zhu M, Zhao S, Li X. rMVP: A Memory-efficient, Visualization-enhanced, and Parallel-accelerated tool for Genome-Wide Association Study, Genomics, Proteomics & Bioinformatics, 2021, 19 (4), 619-628, doi: 10.1016/j.gpb.2020.10.007.

For calculation of K matrix:
Vanraden, P. M. "Efficient Methods to Compute Genomic Predictions." Journal of Dairy Science 91.11(2008):4414-4423.

For GLM(PC) model:
Price, Alkes L., et al. "Principal components analysis corrects for stratification in genome-wide association studies." Nature genetics 38.8 (2006): 904.

For MLM(K) model:
Yu, Jianming, et al. "A unified mixed-model method for association mapping that accounts for multiple levels of relatedness." Nature genetics 38.2 (2006): 203.

For MLM(PCA+K) model:
Price, Alkes L., et al. "Principal components analysis corrects for stratification in genome-wide association studies." Nature genetics 38.8 (2006): 904.

For FarmCPU model:
Liu, Xiaolei, et al. "Iterative usage of fixed and random effect models for powerful and efficient genome-wide association studies." PLoS genetics 12.2 (2016): e1005767.

For variance components:
> HE: Zhou, Xiang. "A unified framework for variance component estimation with summary statistics in genome-wide association studies." The annals of applied statistics 11.4 (2017): 2027.
> EMMA/P3D:
1. Kang, Hyun Min, et al. "Efficient control of population structure in model organism association mapping." Genetics 178.3 (2008): 1709-1723.
2. Zhang, Zhiwu, et al. "Mixed linear model approach adapted for genome-wide association studies." Nature genetics 42.4 (2010): 355.
> Fast-lmm: Lippert, Christoph, et al. "FaST linear mixed models for genome-wide association studies." Nature methods 8.10 (2011): 833.
FAQ and Hints
🆘 Question1: Failing to install "devtools":
ERROR: configuration failed for package ‘git2r’
removing ‘/Users/acer/R/3.4/library/git2r’
ERROR: dependency ‘git2r’ is not available for package ‘devtools’
removing ‘/Users/acer/R/3.4/library/devtools’
😋 Answer: Please try following codes in terminal:
apt-get install libssl-dev/unstable
🆘 Question2: When installing packages from Github with "devtools", an error occurred:
Error in curl::curl_fetch_disk(url, x$path, handle = handle): Problem with the SSL CA cert (path? access rights?)
😋 Answer: Please try following codes and then try agian.
library(httr)
set_config(config(ssl_verifypeer = 0L))
🆘 Question3: When installing MVP:
Error in lazyLoadDBinsertVariable(vars[i], from, datafile, ascii, compress, : write failed ERROR: lazy loading failed for package ‘MVP’ removing ‘/home/liuxl/R/x86_64-pc-linux-gnu-library/3.3/MVP’ Warning message: In install.packages("MVP_1.0.1.tar.gz", repos = NULL) : installation of package ‘MVP_1.0.1.tar.gz’ had non-zero exit status
😋 Answer: It is probably an issue caused by disk full, please check disk space.
Questions, suggestions, and bug reports are welcome and appreciated. ➡️


