English | 简体中文
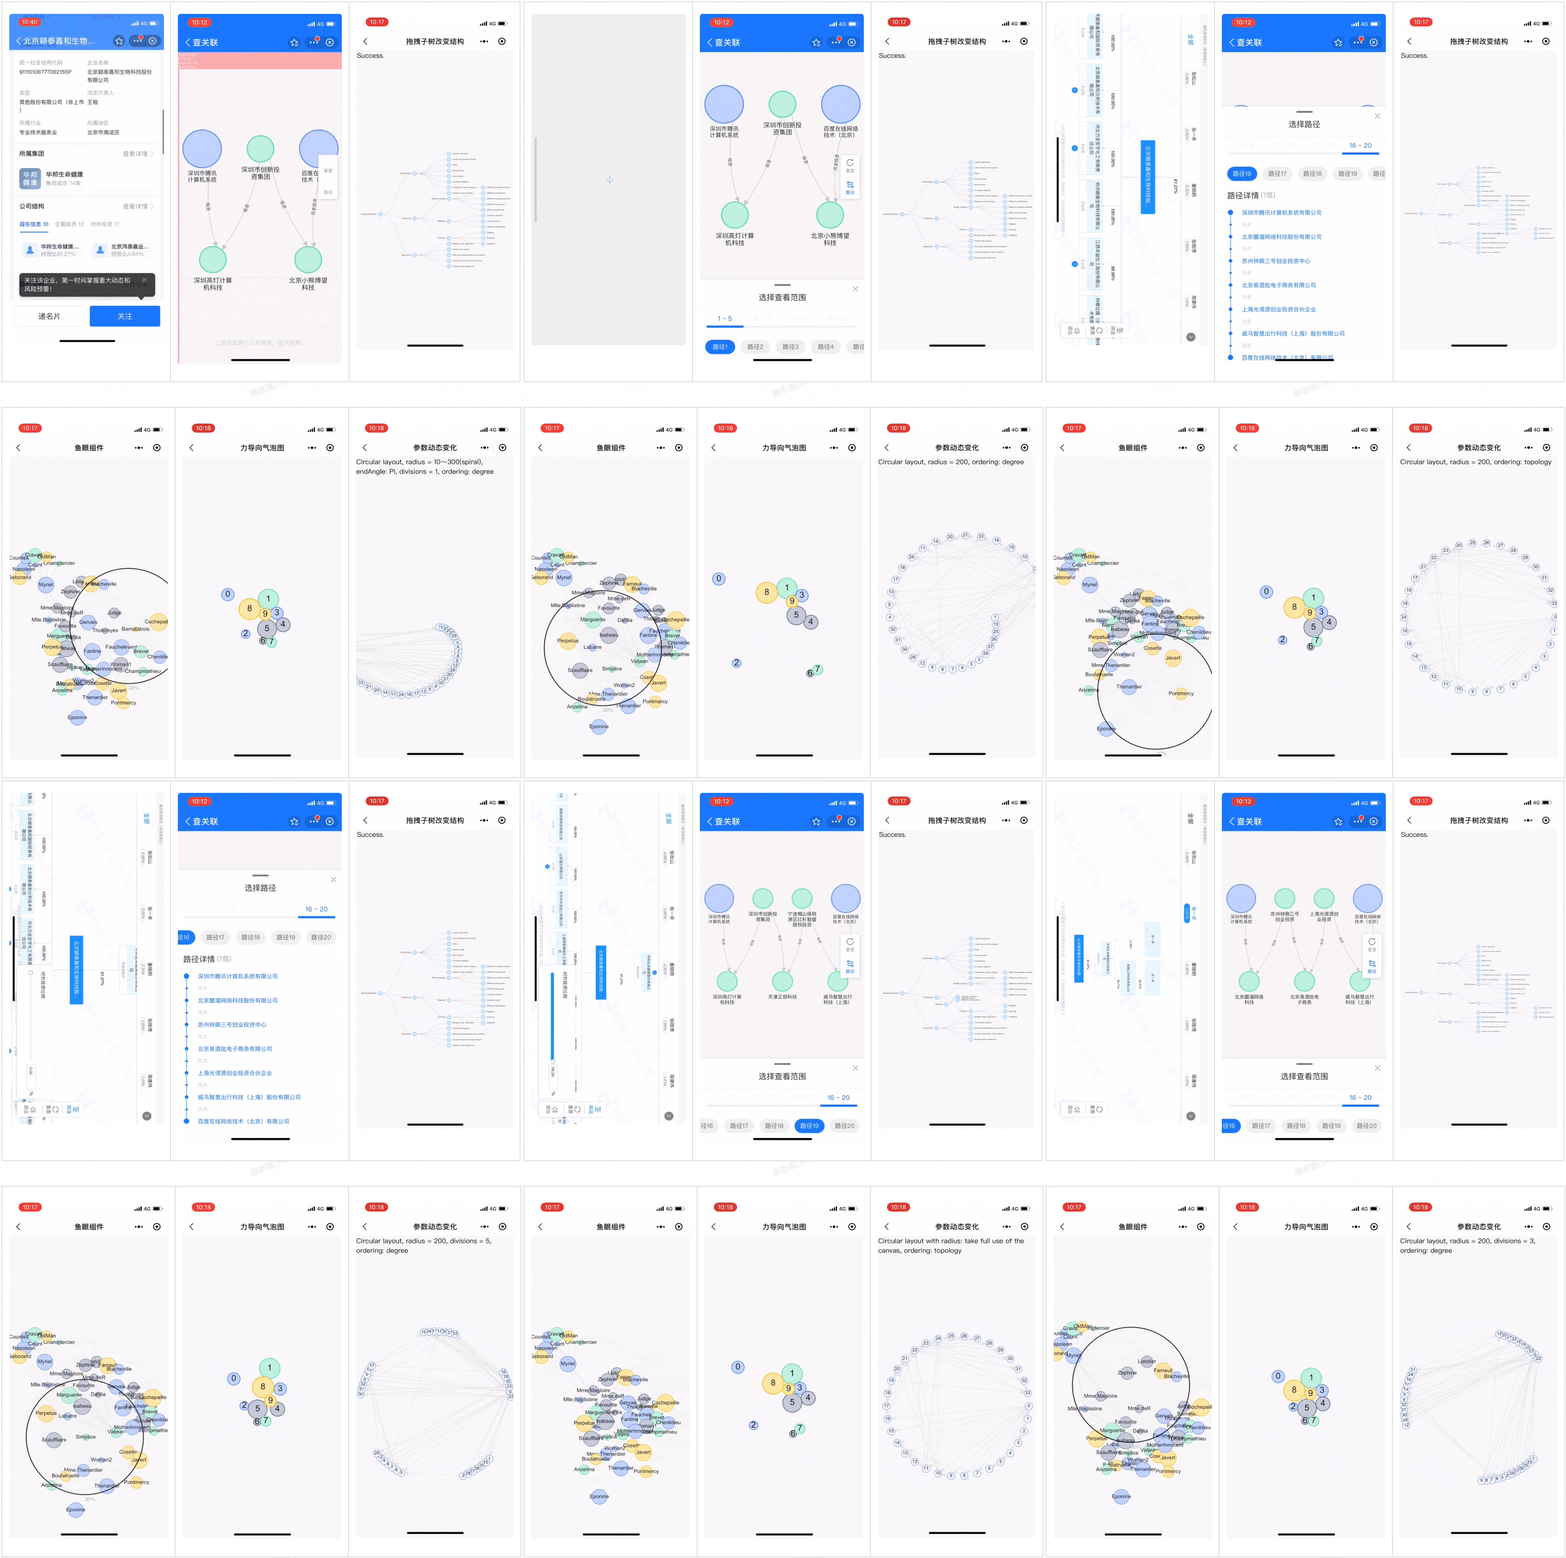
F6 是一款可以快速、流畅运行于移动设备中的图可视化引擎,通过丰富的布局、组件及分析能力,帮助用户落地跨平台的图可视化应用解决方案。在 H5、小程序等移动端平台上,对包体积、性能有更高的要求,也需要定义一套合适的交互模式。针对以上问题,我们在 G6 的基础上重新设计并构建了 F6。F6 不仅具有基础的关联图绘制、事件、动画,同时内置了常用的移动端交互模式、丰富的布局和分析组件,通过简单的配置即可使用。
如果您还没有使用过 F6, 建议通过 快速上手 抢先体验 F6 的魅力。
$ npm install @antv/f6import F6 from "@antv/f6";
import graphData from "./data";
import dagreLayout from "@antv/f6/dist/extends/layout/dagreLayout";
import TreeGraph from "@antv/f6/dist/extends/graph/treeGraph";
F6.registerLayout("dagreLayout", dagreLayout);
F6.registerGraph("TreeGraph", TreeGraph);
Page({
data: {
width: 300,
height: 400,
pixelRatio: 1,
},
onLoad() {
const { windowWidth, windowHeight, pixelRatio } = my.getSystemInfoSync();
this.setData({
width: windowWidth,
height: windowHeight,
pixelRatio: pixelRatio,
});
},
onCanvasInit(ctx, rect, canvas, renderer) {
this.graph = new F6.TreeGraph({
context: ctx,
renderer,
width: this.data.width,
height: this.data.height,
linkCenter: true,
modes: {
default: ["drag-canvas", "zoom-canvas"],
},
defaultNode: {
size: 40,
},
layout: {
type: "compactBox",
direction: "RL",
getId: function getId(d) {
return d.id;
},
getHeight: () => {
return 26;
},
getWidth: () => {
return 26;
},
getVGap: () => {
return 20;
},
getHGap: () => {
return 30;
},
radial: false,
},
});
this.graph.node(function (node) {
return {
label: node.id,
};
});
this.graph.data(graphData);
this.graph.render();
this.graph.fitView();
},
onTouch(e) {
this.graph.emitEvent(e);
},
onUnload() {
this.graph?.destroy();
},
});$ npm install
# lerna bootstrap for multiple packages
$ npm run bootstrap
# build the packages
$ npm run build:all
# if you wanna watch one of the packages, e.g. packages/core
$ cd ./packages/core
$ npm run watch
# run test case
$ npm test
# run test case in watch mode
npm test -- --watch ./tests/unit/algorithm/find-path-spec
DEBUG_MODE=1 npm test -- --watch ./tests/unit/algorithm/find-path-spec更详细的内容请参考 快速上手 文档。
欢迎各界 F6 使用者、图可视化爱好者加入 F6 超级服务群(钉钉群,使用钉钉扫一扫加入)讨论与交流。
请让我们知道您要解决或贡献什么,所以在贡献之前请先提交 issues 描述 bug 或建议。
成为一个贡献者前请阅读 代码贡献规范。


