animplotlib
This package acts as a thin wrapper around the
matplotlib.animation.FuncAnimation class to simplify animating matplotlib
plots.
Installation
pip install animplotlib
User manual
There are two classes which can be called: AnimPlot, for 2-D plots,
and AnimPlot3D, for 3-D plots.
AnimPlot
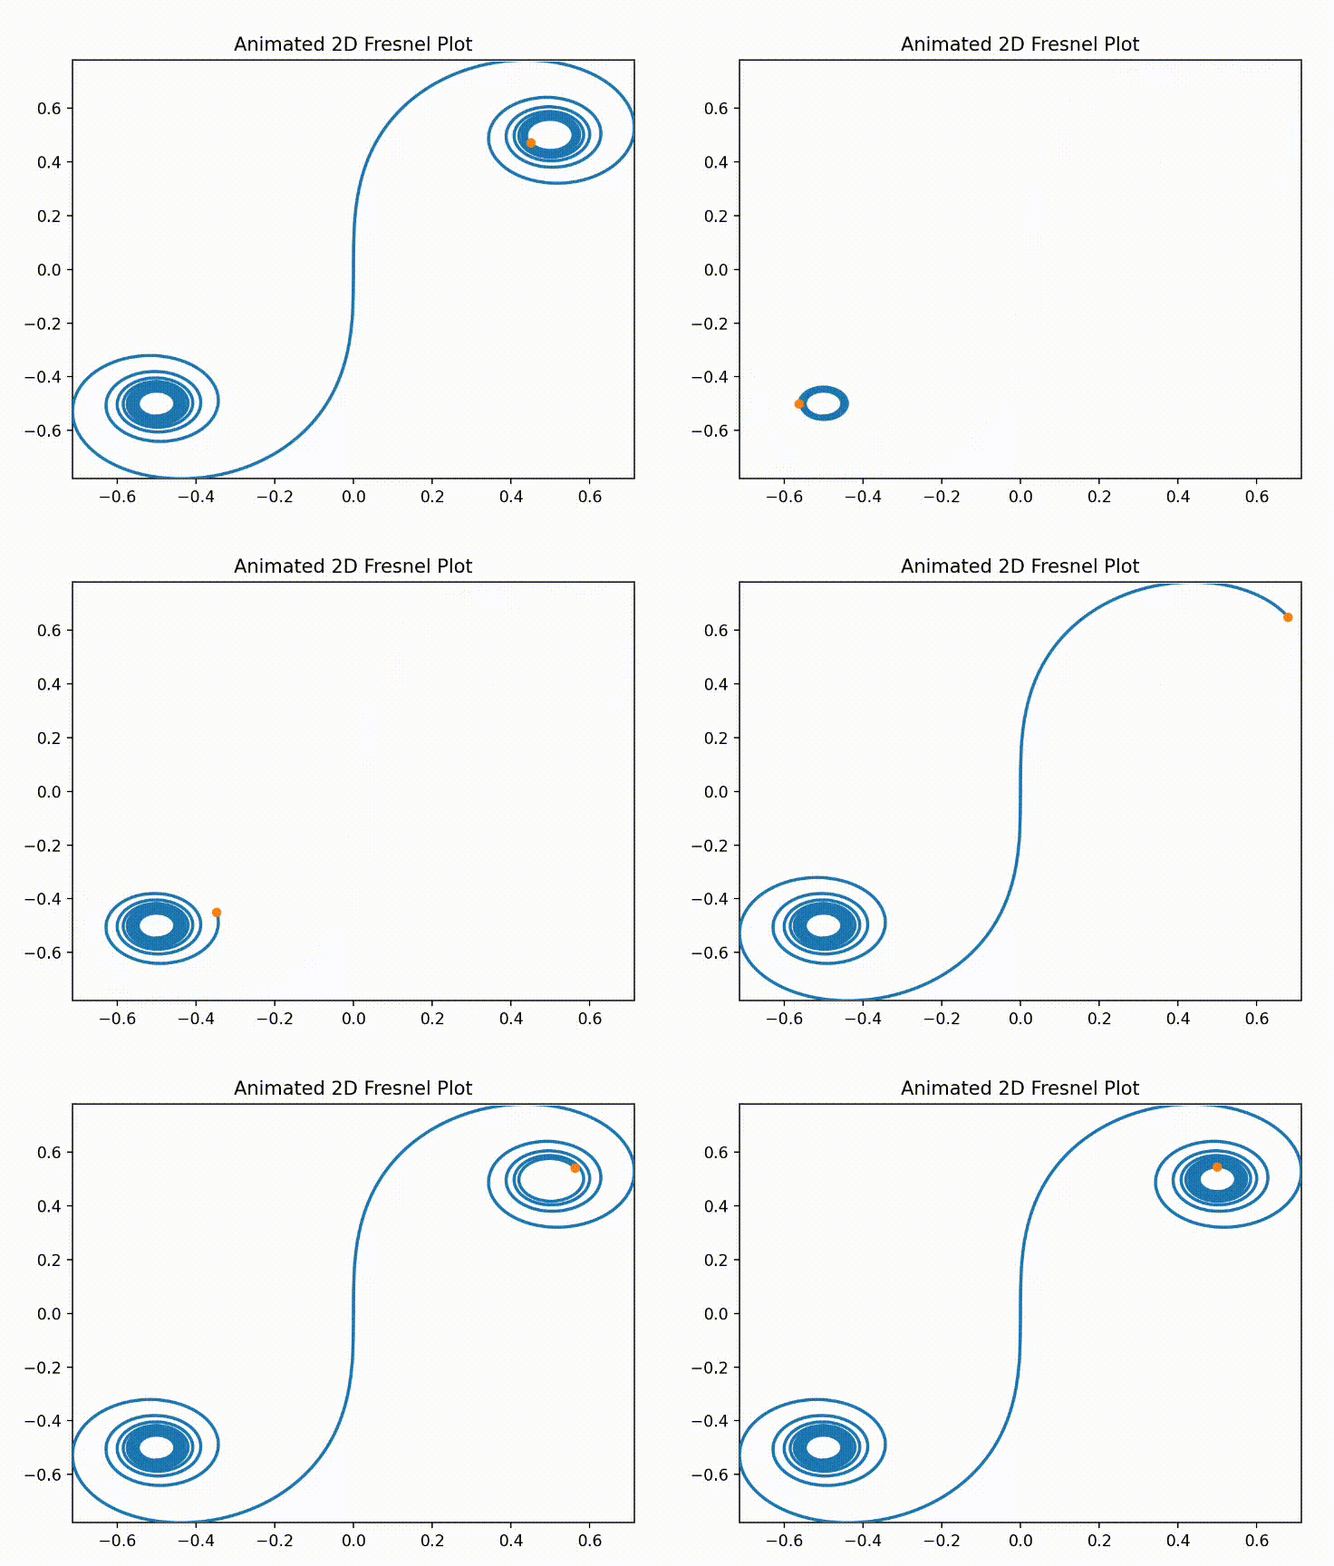
As an example, below is a demonstration of the steps required to make a
basic plot of an Euler spiral. An Euler spiral can be obtained by plotting
the Fresnel integrals,
which can be generated using scipy.special.
Import the necessary libraries and create a matplotlib figure and axes:
import animplotlib as anim
import numpy as np
import matplotlib.pyplot as plt
import scipy.special as sc

fig = plt.figure()
ax = fig.add_subplot(111)
Generate the points being plotted:
x = np.linspace(-10, 10, 2500)
y, z = sc.fresnel(x)
Create two empty matplotlib plots: one to plot the points up to the current
most point (i.e. the 'line') and one to plot the current most point:
line, = ax.plot([], [], lw=1)
point, = ax.plot([], [], 'o')

ax.set_xlim(-1, 1)
ax.set_ylim(-1, 1)
Call the AnimPlot class and show the plot:
animation = anim.AnimPlot(fig, line, point, y, z)
plt.show()
Optional arguments:
-
plot_speed(int) : set to 10 by default. -
save_as(str) : file name to save the animation as a gif in the current working directory. -
**kwargs: other arguments passable intomatplotlib.animation.FuncAnimation(see the docs for more info).
AnimPlot3D
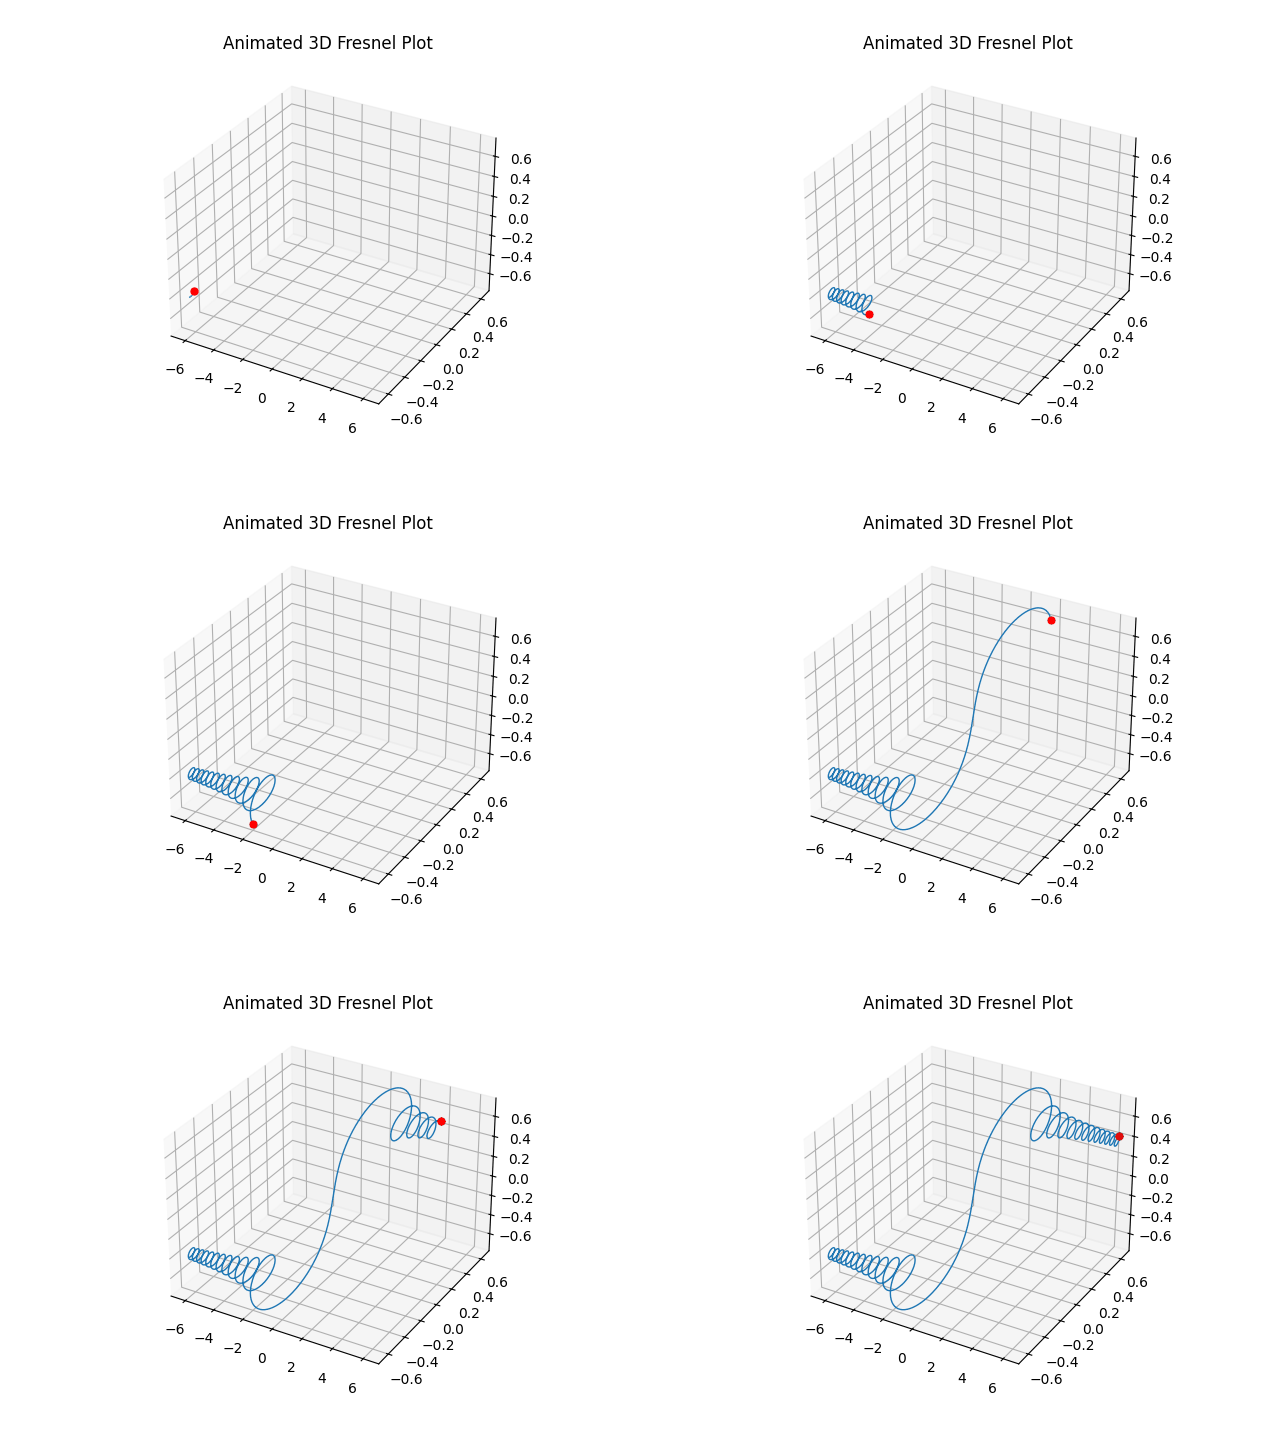
Creating a 3-D animated plot is similar to creating a 2-D plot but with a few additional steps.
import animplotlib as anim
import numpy as np
import matplotlib.pyplot as plt
import scipy.special as sc

fig = plt.figure()
ax = fig.add_subplot(111, projection='3d')

x = np.linspace(-10, 10, 3000)
y, z = sc.fresnel(x)
For 3-D plots, two empty matplotlib plots must be created:
lines, = [ax.plot([], [], [])]
points, = [ax.plot([], [], [], 'o')]
The second plot, points, by default plots the 'ith' point each frame. After
that set the x, y and z limits and call the AnimPlot3D class.
ax.set_xlim(-10, 10)
ax.set_ylim(-1, 1)
ax.set_zlim(-1, 1)

animation = anim.AnimPlot3D(fig, ax, [lines], [points], x, y, z, plot_speed=5)
plt.show()
Optional arguments:
-
plot_speed(int) : set to 10 by default. -
rotation_speed(int) : proportional toplot_speed. Off by default, enabled by setting a value. -
l_num(int) : The number of points being plotted tolineseach frame. By default, all the points up until the current point get plotted. -
p_num(int) : The number of points being plotted topointseach frame. By default, this is set to 1, i.e. only the current most point is plotted each frame (the orange point in the gif). -
save_as(str) : file name to save the animation as a gif in the current working directory. -
**kwargs: other arguments passable intomatplotlib.animation.FuncAnimation(see the docs for more info).
Both the 2-D and 3-D plots can be customised visually the same way you would
a normal matplotlib plot.


