docker-load-graph
Have you ever been working with a docker stack, and been interested in how your containers fair over time? Me too.
This project exists to solve that problem.
What does it do?
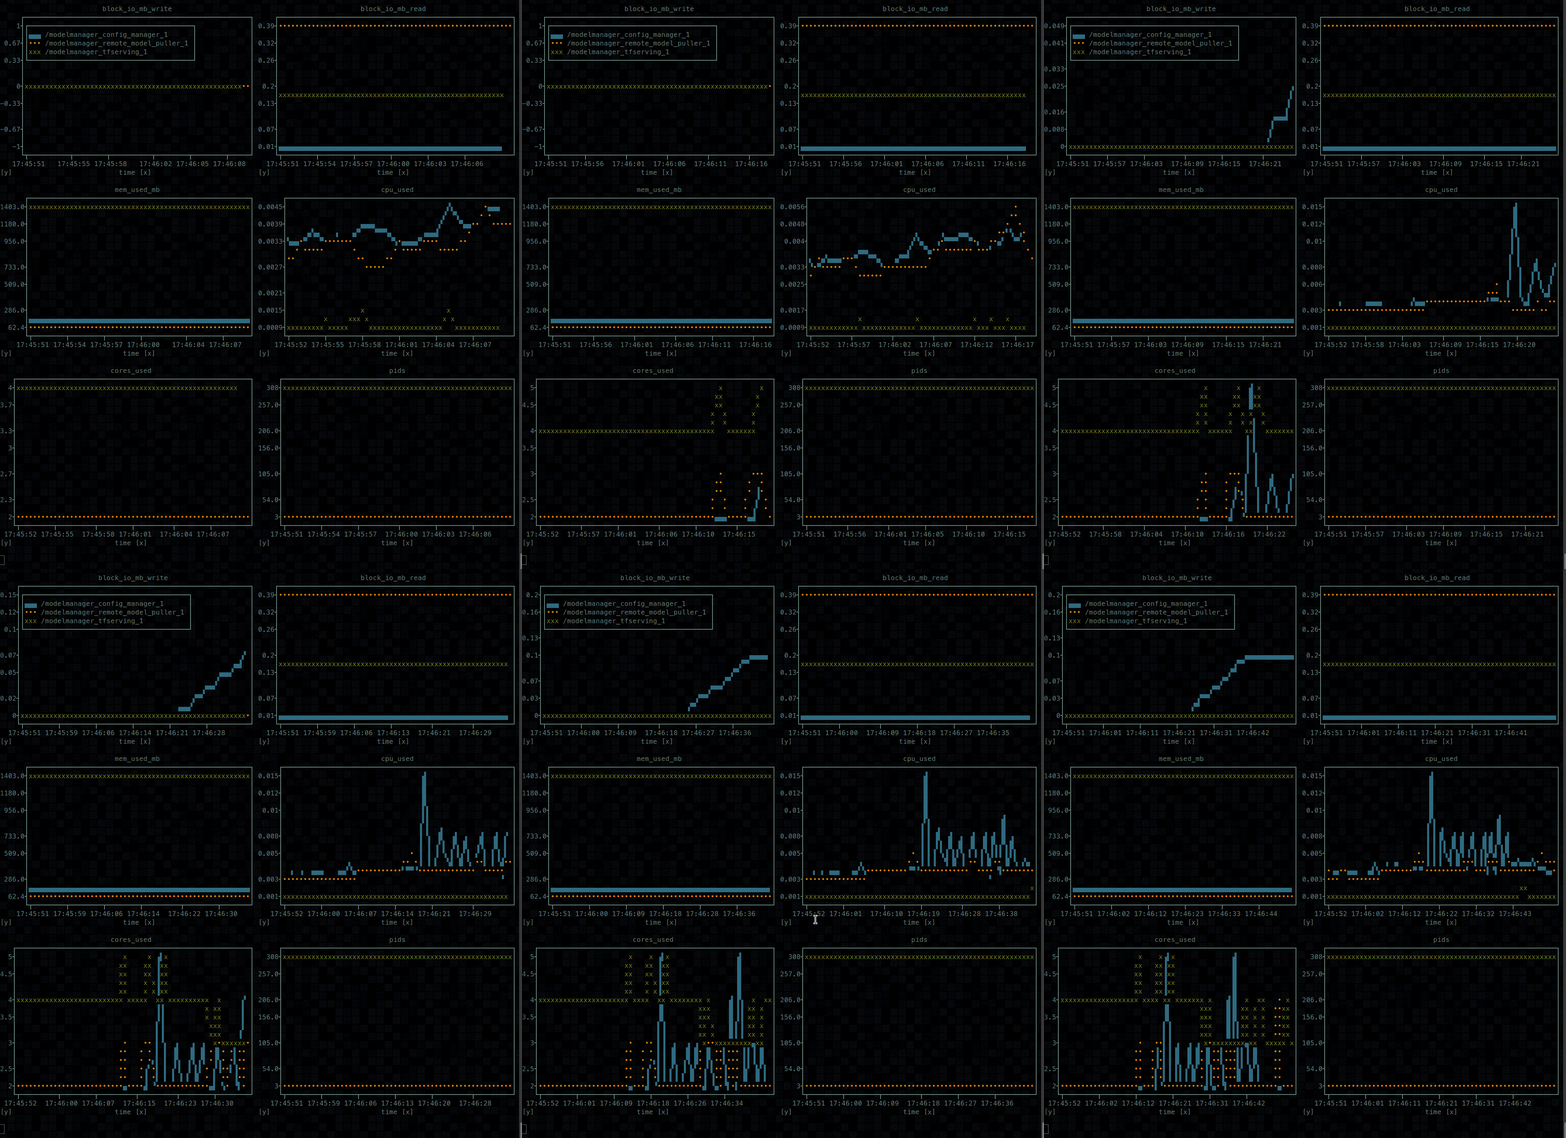
Very simply this project uses plotext to display the current status of key docker container metrics in real time on the command line.
How do I use it?
I've uploaded this project to the PYPA repository for pip to access. You can simply install this using python3.7> with
pip install docker-load-graph
To execute this project run:
docker-load-graph
It is just that simple.
