NMSLIB-viz

![]()
![]()


Installation
Install client via pip. Ideally, nmslib-viz is well supported for Python >= 3.7.
pip3 install nmslib-viz --no-binary nmslibThe
--no-binaryoption is important for a better CPU performance.
Usage
Just run it like this:
nmslib-viz INDEX_FILE_PATH [--number_points NUMBER_POINTS]Arguments:
-
INDEX_FILE_PATH: String pointing to the NMSLIB file path. There has to be the additional .dat file for the index, the one that is created when uses thesave_data=Trueoption in the saveIndex() function. For example:index.nmslibandindex.nmslib.datneed to exist but onlyindex.nmslibhas to be provided as this parameter. -
NUMBER_POINTS: (optional) Number of points as a maximum to plot from the NMSLIB index data, where has to be 1 at least. Default value: 1000.
Result
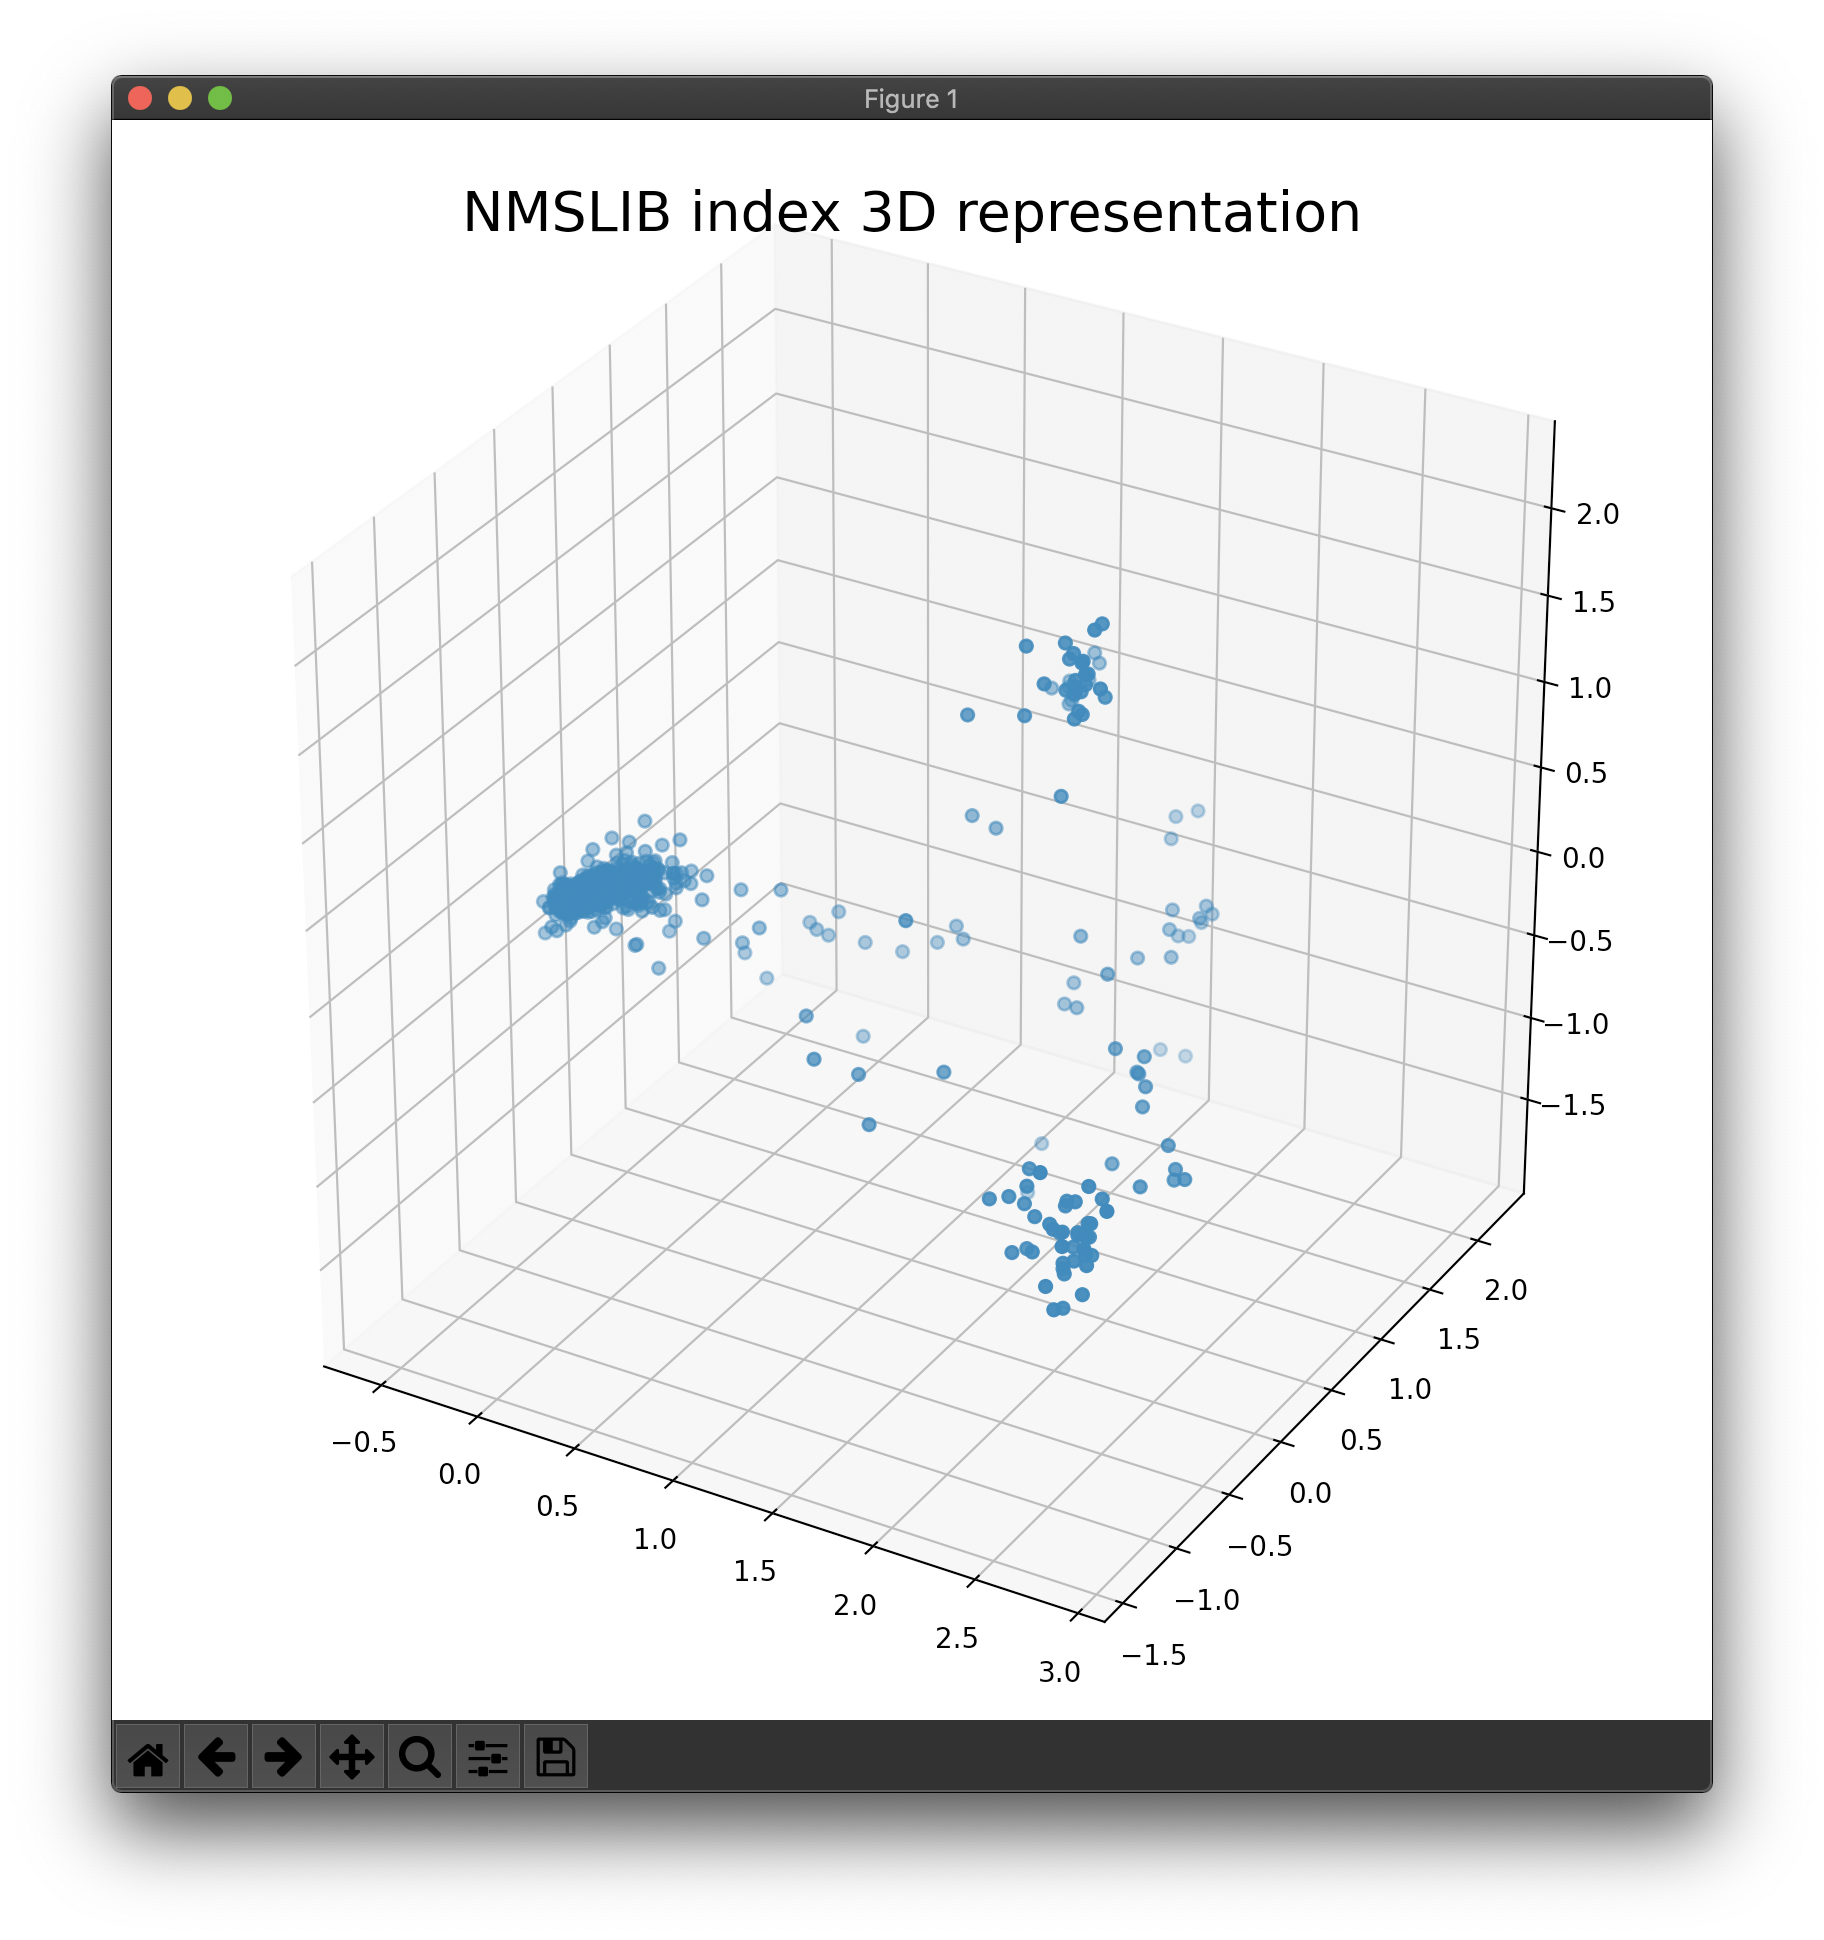
Note: this example is a representation of the SearchLy index.
Development
Recommendations
Usage of virtualenv is recommended for package library / runtime isolation.
Installation
-
Setup virtual environment
-
Install dependencies
pip3 install -r requirements.lock- Install locally
pip3 install . --no-binary nmslibContributing
Suggestions, improvements, and enhancements are always welcome! If you have any issues, please do raise one in the Issues section. If you have an improvement, do file an issue to discuss the suggestion before creating a PR.
All ideas – no matter how outrageous – welcome!
Authors
License
Apache-2.0 © nmslib-viz
